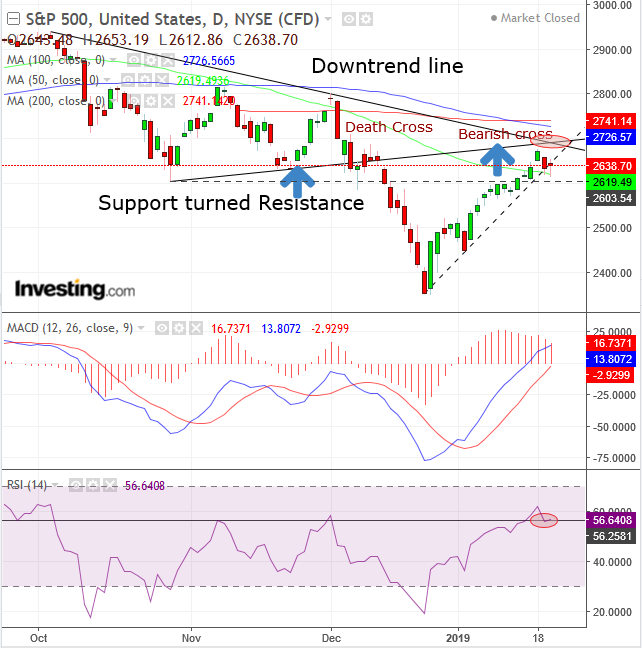
Once again, investors find themselves in the uncomfortable position of deciding which way the S&P 500 might be headed next, amid mounting conflicting fundamentals. While Europe and China are showing increasing signs of a slowdown, the U.S.'s economy is still chugging along, albeit in a very late phase of the business cycle.
As well, the bull market for equities, now the longest on record, may be getting too old for all the whipsawing that's been occurring. There's a good chance the market might just decide to go into hibernation. With that in mind traders and investors can't be faulted for wondering if there's still some life left in this bull market.
Most company executives and hedge fund managers seem to think there is. Growth will undoubtedly slow, after factoring in an economic boom that was largely manufactured by the biggest tax cut in history. Still, most believe there will be modest growth, sufficient to support stock prices.
We, however, maintain our position, in place since the late December rout, that a retracement was likely to follow before the next leg down, in a downtrend. That was indeed what happened, to the tune of 13% gains. But technicals are now signaling there could be another slide ahead.

From October through December the S&P 500 was in a bind, as bulls and bears negotiated the direction of the trend. Once the bears won the tug-of-war, they took prices down to the brink of a 20% decline that is the widely accepted threshold for a bear market. While the price didn't complete the bull-to-bear reversal threshold, it posted a second low, to complete the required descending series that marks a downtrend.
Note that the recent eight days of gains out of 10, were stopped at the intersection where the downtrend line from the September record-peak meets the bottom of the October-December range. It's where many traders have had a dog in the fight, increasing the presumed resistance.
Also, the downtrend line‘s significance is underscored by a Death Cross, which was followed by another bearish cross, as moving averages, among other signals, demonstrate that prices are weakening.
RSI is struggling to maintain momentum and the MACD is curving down, a sell signal. Obviously anything can happen in markets, especially with so many risks in place. Nonetheless, our money’s on another rout.
Trading Strategies – Short Position Setup
Conservative traders should wait for prices to fall below the short-term uptrend line since what we consider to be the post-Christmas dead cat bounce. Then they would wait for a potential pull-back to retest the broken, short-term uptrend line and the medium-term downtrend line since September.
Moderate traders might be content with a close below 2,600, the horizontal support since October 20.
Aggressive traders may short now, provided they can afford a stop loss, at least above Friday's high of 2,675.47, if not the 2,700 psychological level, which is also right on top of the above described resistance-confluence.
Trade Sample:
- Entry: 2,650, below yesterday’s intraday high
- Stop-loss: 2,700
- Risk: 50 points
- Target: 2,500 – psychological support
- Reward: 150 points
- Risk-Reward Ratio: 1:3
