- Sterling returns to bottom of pattern on Trump's negative Brexit outlook
-
- Chinese investors ignore Trump’s latest tariff threats
- Volatility remains at recent highs but shows signs of subsiding
- FAANGs, retailers, CVS all rally
Key Events
Monday's global stock rally fizzled out during the European session this morning, with the STOXX 600 and futures on the S&P 500, Dow and NASDAQ 1000 slipping lower.
The euro also edged lower as eurozone bonds rallied.

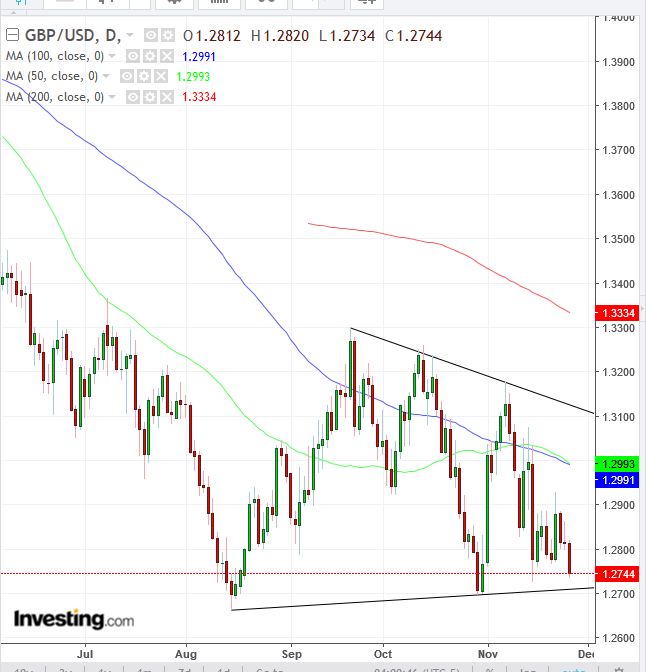
The pound fell as traders tried to assess the likelihood of parliamentary approval for Prime Minister Theresa May's Brexit deal, amid remarks, by US President Donald Trump, that the draft agreement could jeopardize the UK’s ability to strike a trade pact with the US. Technically, this drop, for a third day, brings the GBP price back to the bottom of a symmetrical triangle, bearish after a decline. Contrarian investors may go long, with a stop-loss beneath the 1.2700 level, receiving an exceptional risk-reward ratio should the price retest the 1.3000 top level.
In the earlier Asian session, shares on Japan’s Nikkei 225 gained ground, (+0.64%), while they ended mostly flat on Hong Kong’s Hang Seng (-0.17%) and China’s Shanghai Composite (-0.04 percent). The relative resilience of Chinese investors is noticeable in the wake of Trump's signals that the US is prepared to press ahead with its planned round of tariffs on $200 billion worth of Chinese goods in January—though a spokesman for China’s foreign ministry said the two counterparts had agreed to reach a deal in a November 1 phone call.
Global Financial Affairs
Yesterday, all US majors rallied at least 1 percent. After dragging the broader market down during the recent selloffs, technology stocks led the charge, leaving market participants wondering how much longer the current roller coaster—one of the wildest in five years on a monthly basis—will go on.

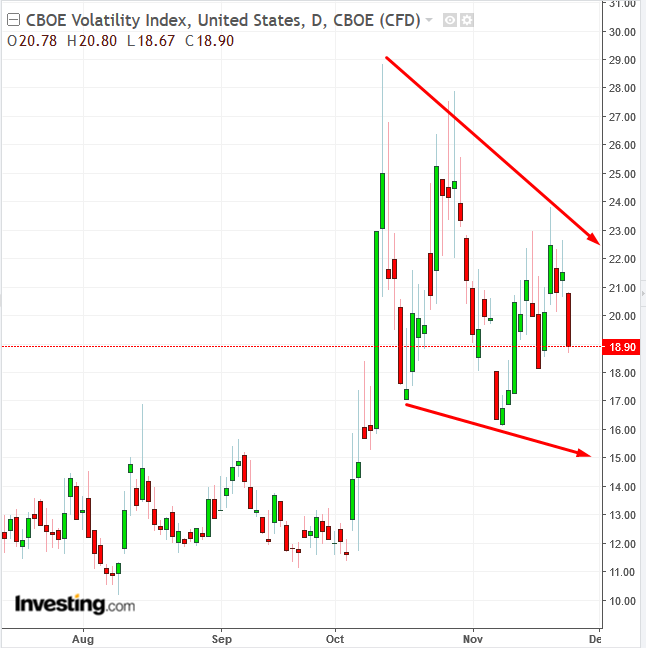
As we’ve been pointing out, volatility is still hovering at the highest levels since April and all of last year. However, it has been subsiding since the wild price swings of early October, suggesting traders are reducing their bets for further volatility.
The S&P 500 leaped 1.55 percent, reversing the worst weekly performance in a month, as traders focus on the strong start to the holiday season, viewing it as a good omen for an economic uptrend. Almost every sector closed in the green, with Communication Services (+2.28%) outperforming followed closely by Technology (+2.26%) and Consumer Discretionary (+2.24%). Despite the best performance in almost three weeks, the SPX underperformed major US indices. Consumer Staples (-0.13%) underperformed.

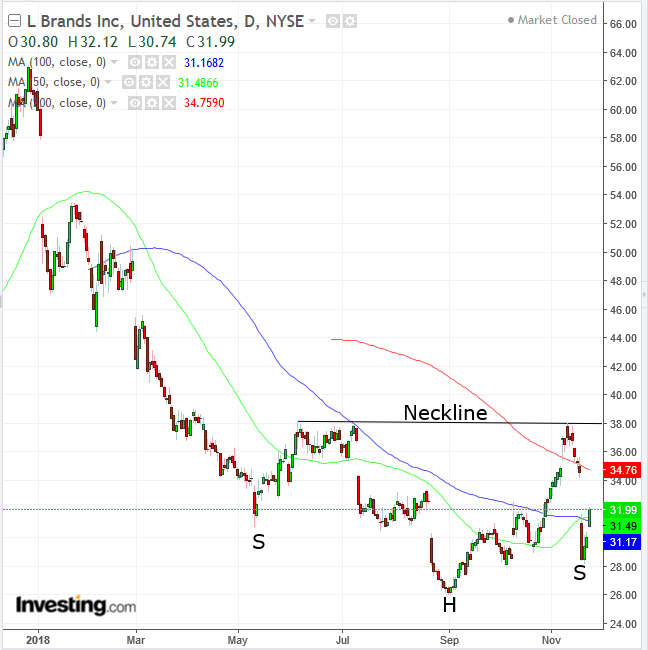
L Brands (NYSE:LB) (+6.74%) led retailers' gains as it formed an H&S bottom, whose upside breakout above $38 would suggest a $50 target. Amazon.com (NASDAQ:AMZN) surged 5.28 percent and the other FAANG stocks gained at least 1 percent. CVS Health (NYSE:CVS) rallied 3.54% after it won the New York regulator’s approval for its merger with health insurer Aetna (NYSE:AET).
Microsoft (NASDAQ:MSFT) (3.3%) led the Dow Jones Industrial Average's 1.46 percent advance. American Express (NYSE:AXP)'s 3.73% leap and Boeing (NYSE:BA)’s more modest 1.29% gain also helped the Dow higher, given the stocks' respective 3 percent and 8.71 percent weight on the index.
The tech-heavy NASDAQ Composite sprinted 2.06% forward, outperforming its peers, while the Russell 2000 edged 1.15 percent higher.

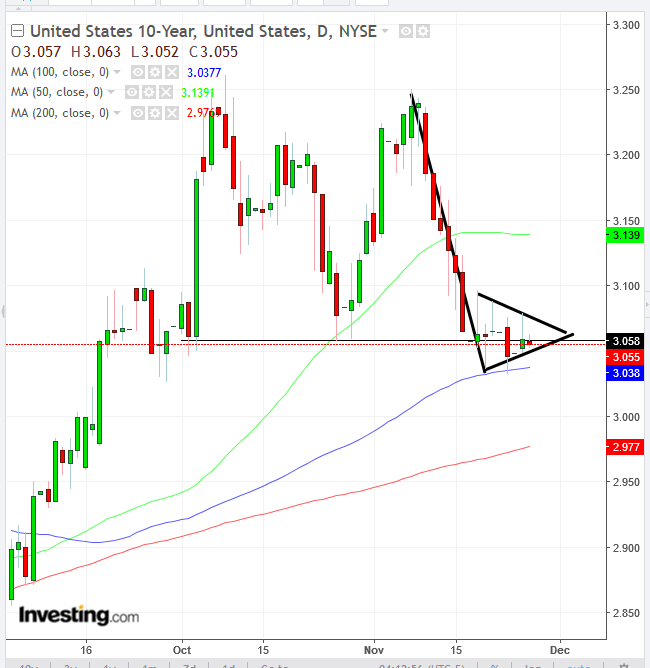
Yields on 10-year Treasurys consolidated despite yesterday’s bullish equity rally. Technically, the rate is forming a pennant, bearish in a downtrend, right on the very neckline of a double top reversal. The downside breakout would complete both the patterns suggesting a penetration below 3%.
The dollar is charging ahead for a third day, breaking its tie to Treasurys. A further 0.5 percent rise would take it to the highest level since June 2017.
Meanwhile, Bitcoin is nearing our $3,000 target at $3,766 as the time of writing. Could a slowdown in cryptocurrency mining be triggering the collapse?
WTI crude inched lower but remained above $51.00, while Brent fell back towards $60 a barrel—though both bounced back in the late European morning.
The upcoming G20 summit, which begins on November 30 and Fedspeak will bring the two most significant headwinds in the spotlight to this late business cyclet: Sino-US trade relations and the US interest rate tightening path.
Fed Chairman Jerome Powell’s speech on Wednesday in particular will be closely watched for the latest thinking on the central bank's tightening pace, as investors remain on the back foot amid heightened volatility and try to second-guess whether there will be a pause in rate hikes next year.
As to the former point, Trump's latest tariff threat to China may further pressure a market that is already under strain. However, a resolution would undoubtedly carry a much bigger payoff, potentially propelling equities back into their longest bull market on record.
Up Ahead
- Presidents Donald Trump and Xi Jinping plan to meet at the G-20 summit in Argentina that kicks off on Friday.
- Federal Reserve Vice Chairman Richard Clarida speaks in New York on Tuesday and Powell addresses the New York Economic Club on Wednesday.
- Thursday sees the release of the minutes from the Federal Open Market Committee’s November meeting.
Market Moves
Stocks
- The MSCI All-Country World Index climbed less than 0.05 percent to the highest in more than a week.
- The MSCI Emerging Market Index fell less than 0.05 percent.
Currencies
- The Dollar Index gained 0.12 percent for the third day and 0.48%, to the highest close in two weeks.
- The euro declined 0.2 percent to $1.1308, the weakest in two weeks.
- The Japanese yen decreased less than 0.05 percent to 113.60 per dollar, the weakest level in more than a week.
- The British pound fell 0.6 percent to $1.2747, the weakest level in four weeks on the most significant drop in more than a week.
- The MSCI Emerging Markets Currency Index slid 0.2 percent to the lowest level in almost two weeks on the most substantial decrease in more than two weeks.
Bonds
- Germany’s 10-year yield declined two basis points to 0.34 percent, the lowest level in 12 weeks.
- Britain’s 10-year yield fell three basis points to 1.375 percent, the lowest level in more than a week.
- The spread of Italy’s 10-year bonds over Germany’s increased two basis points to 2.9245 percentage points.
Commodities
- The Bloomberg Commodity Index slipped 0.6 percent to the lowest level in 17 months.
- LME copper fell 1.1 percent to $6,118.00 per metric ton, the lowest level in almost two weeks on the biggest fall in a week.
- Gold dropped 0.2 percent to $1,220.19 an ounce, the weakest level in more than a week. Investors will likely wait to see whether Trump's trade tariffs threats translate into action before deciding on their direction.
