- Futures suggest reversal of post-midterm vote rally
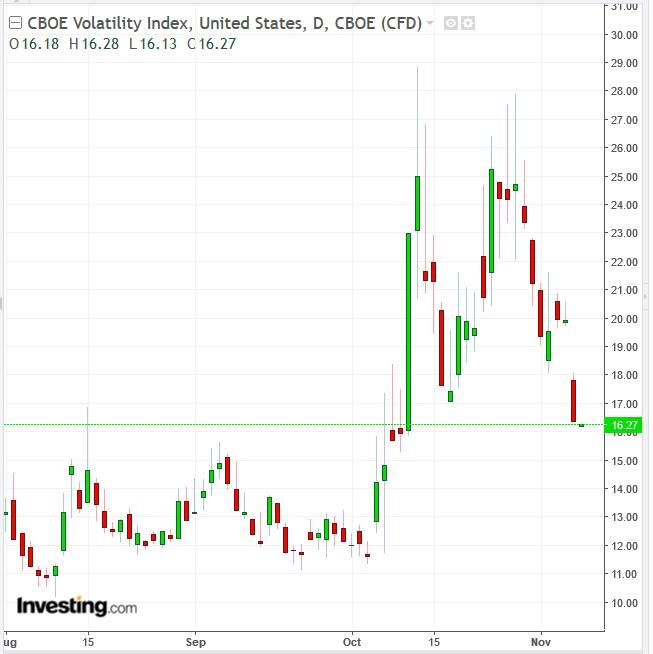
- Volatility falls to near-month low but could rise if US congressional gridlock clouds policy, initiative outlook
- Tech, Health Care shares lead US gains
Key Events
Positive European earnings added to the knock-on effect of yesterday's US rally post midterm elections, after Asian indices mostly moved higher this morning. However, futures on the S&P 500, Dow and NASDAQ 100 suggest investor optimism may not make it across the Atlantic today.

During the US session volatility subsided to the lowest level in almost a month but then picked up quickly, and we expect it may start climbing higher if any US government gridlock results in a political tug of war that hinders policy implementation and stability.
The STOXX Europe 600 climbed for a second day, led by shares in the travel and leisure sector. The price dip in Italy’s largest lender UniCredit (MI:CRDI) offset higher gains for the pan-European benchmark after the bank provided softer guidance, joining many firms that revised their guidance lower this quarter, on trade concerns. Siemens (DE:SIEGn) Europe’s biggest engineering company, gained after increasing dividends and announcing it will buy back EUR3 million of shares. Expect exceptional volatility in Europe today as roughly 50 members of the index release earnings.
During the earlier Asian session, regional benchmarks closed higher, except for China's Shanghai Composite (-0.22 percent), which extended a fall to the fourth day for a total loss of 1.65 percent as traders remain pessimistic over a trade war breakthrough—amid the looming threat of further tariff hikes. They also await action after repeated government promises of policies to boost a waning economy and unstable markets. Japan’s Nikkei 225 outperformed its major Asian peers, climbing 1.83 percent, as the yen weakened for the fourth session out of five, boosted the benchmark’s outlook for exports.
Global Financial Affairs
Yesterday, stocks in the US surged as investors mulled over the potential impact of midterm elections.

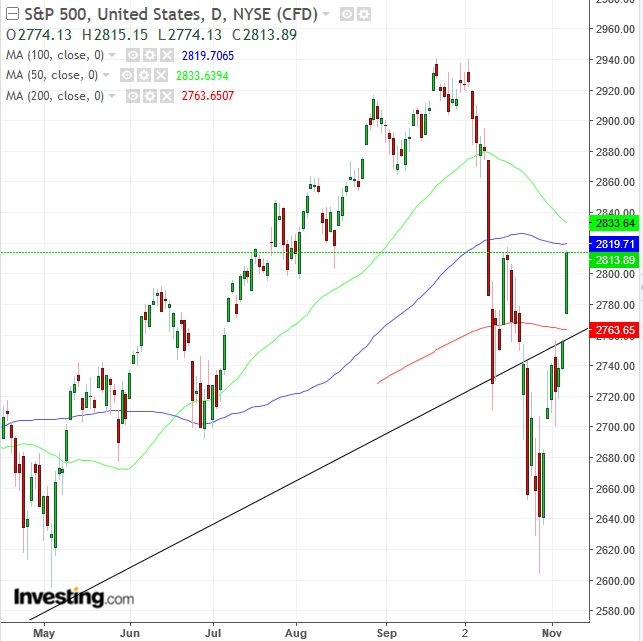
The S&P 500 jumped 2.12 percent, with every sector gaining over 1 percent except for Consumer Staples (+0.57 percent). Health Care outperformed (+2.94 percent), as the outlook for insurers and hospitals seemed a lot brighter post the midterm vote. The Democrat's new majority in the House greatly reduces the chances, going forward, of any health care repeal. Moreover, several states passed ballot initiatives to expand Medicaid under the Affordable Care Act.
Technology (+2.92 percent) followed Health Care closely, as risk-oriented investors bought into what, prior to the selloff, was consistently the best performing sector. Traders are probably expecting that if stocks are climbing back, tech shares are likely to continue to lead. Amazon (NASDAQ:AMZN) (+6.86 percent) and Netflix (NASDAQ:NFLX) (+5.36 percent) were among yesterday's the best performers.
Technically, The SPX climbed back above its uptrend line since the previous correction of January 2016, as well as jumped clear over the 200 DMA, stopping below the 100 and 50 DMAs. The benchmark closed near the height of the session, demonstrating bullishness.
The Dow Jones Industrial Average added more than 500 points, advancing 2.13 percent. Technically, it climbed above the 50 DMA, after already moving past the 200 DMA, then the 100 DMA. It closed near the top of the session, demonstrating investors’ commitment to their positions.
The NASDAQ Composite outperformed, gaining 2.64 percent, as investors who cashed out causing the selloff came back for more. Technically, it climbed back over the 200 DMA, but the 50 DMA crossed below the 100 DMA, providing a mixed outlook.
The Russell 2000 underperformed, climbing 1.7 percent. The small-cap benchmark remains the only major US index which is still below both its uptrend line since the previous correction and its 200 DMA. Also, its 50 DMA fell below its 100 DMA.

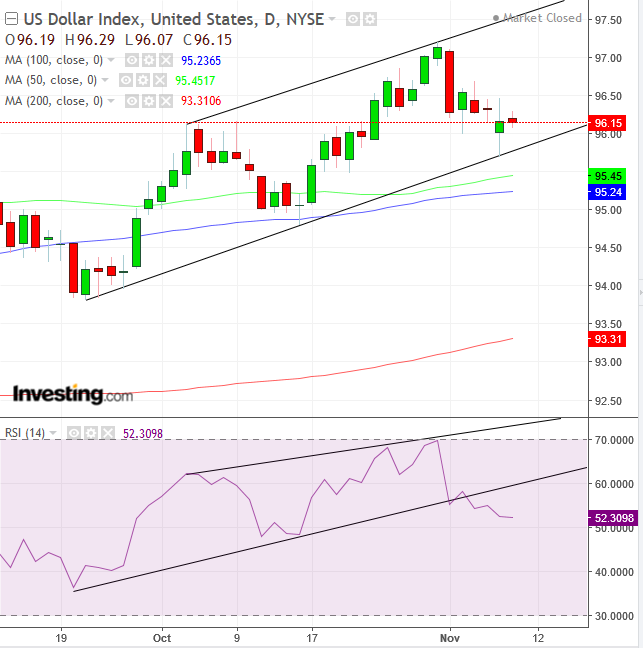
The dollar is slipping for a second day, ahead of a Federal Reserve interest rate decision. As well, the renewed sense of risk-on weighs on the USD, which has benefited from its safe haven status since the start of the US-China trade dispute in March. Moreover, foreign investors cash out of US Treasurys and repatriate funds, which naturally includes a forex transaction against the buck. Technically, the Dollar Index yesterday found support at the bottom of a rising channel. However, the RSI demonstrates that momentum fell through its channel bottom, increasing the odds that prices will follow suit.
WTI crude bounced after soaring US production outweighed OPEC plans for supply cuts. However, it was later seen wavering under neutral levels. Technically, the bounce comes after the price reached less than 5 percent from its long-term uptrend line since the early-2016 bottom and after entering the most oversold condition since the same time.
Up Ahead
- US jobless claims, out today, are expected to have remained steady at 214K.
- The Fed is expected to hold rates at his last policy meeting before the end of the year, though analysts will watch closely for any further clues on direction
- Hawkish commentary after the RBA interest rate decision, coming up today, could lift the Australian dollar.
- Data tomorrow will likely show that China CPI for October has remained flat.
Market Moves
Stocks
- The Stoxx Europe 600 gained 0.4 percent to the highest in a month.
- Futures on the SPX dropped less than 0.05 percent.
- The UK’s FTSE 100 climbed 0.2 percent to the highest in more than four weeks.
Currencies
- The Dollar Index fell less than 0.05 percent to 1,197.14, the lowest level in more than two weeks.
- The euro increased 0.1 percent to $1.1442, the strongest level in more than two weeks.
- The British pound climbed 0.1 percent to $1.3142, the strongest level in more than three weeks.
Bonds
- The yield on 10-year Treasurys fell two basis points to 3.22 percent, the biggest fall in almost two weeks.
- Germany’s 10-year yield climbed one basis point to 0.46 percent, the highest level in almost three weeks.
- Britain’s 10-year yield was unchanged at 1.559 percent.
Commodities
- Gold slipped 0.1 percent to $1,225.14 an ounce, hitting the weakest level in more than a week with its fifth consecutive decline. Any impact from the US Congress shift on Fed's monetary policy could potentially move the price of yellow metal.
- West Texas Intermediate crude climbed 0.3 percent to $61.88 a barrel, the first advance in almost two weeks.
