- European shares hold onto gains, US futures follow Asian markets lower
- US major indices register second lower trough, establishing new downtrend
- Small cap stocks underperformance strengthens case for market top
Key Events
European stocks opened higher and kept climbing this morning, while futures on the S&P 500, Dow and NASDAQ 100 extended yesterday’s slide, in line with earlier Asian losses. Safe haven assets were mixed, with the yen falling, allowing the dollar to climb, even as Treasury yields were falling.
Gains in builders shares helped the Stoxx 600 hold onto positive territory, though the pan-European benchmark slightly pared an early 0.7 climb. Barclays (LON:BARC) edged higher on positive earnings, while Deutsche Bank (DE:DBKGn) stock was sold off after softer revenue guidance.
During the earlier Asian session, a rebound for China’s Shanghai Composite (+0.33 percent) from a 0.55 percent decline and for Japan’s TOPIX (+ 0.08 percent) from a 0.73 percent fall—to the lowest level since mid-September 2017—spared the MSCI Asia Pacific Index from entering a bear market.
Global Financial Affairs
Most US stocks closed lower for the fifth day on Tuesday, even after dip buyers almost wiped out losses. Safe haven assets such as the yen, gold and US Treasurys followed an opposite trajectory, as investors back-pedaled into equities.
The S&P 500 pared an intraday 2.34 percent dip to 0.55. The earlier plunge took prices below 2,700, to the lowest level since late-May, mostly dragged lower by Energy shares (-2.62 percent) following a 4 percent slide in crude oil. Industrials (-1.65 percent) was the second worst performer. The other sectors managed to limit losses to under 1 percent, with Materials (+0.99 percent) at the top of that group. Real Estate (+0.64 percent) outperformed, followed by Consumer Staples (+0.44 percent).
The Dow Jones Industrial Average trimmed a 2.17 percent loss to 0.5 percent, closing below the 25,000 mark for the first time since July 12.
The NASDAQ Composite closed 0.42 percent lower, after rebounding from a 2.79 percent slump and entering “correction territory.” The term “correction” in this context refers to when stocks fall at least 10 percent from a peak: while the designation can be seen as arbitrary, it nevertheless creates a panic that may cause a self-fulfilling prophecy of further selloffs. However, the truth of the term would need to be based on a closing level. After yesterday's close, the NASDAQ decline from its August 30 peak is only 8.55 percent.
From an individual stock perspective, Verizon (NYSE:VZ) and McDonald's (NYSE:MCD) advanced on solid results, while Netflix (NASDAQ:NFLX) led gains in tech shares. Industrial stocks remained under pressure after disappointing results from Caterpillar (NYSE:CAT) and 3M (NYSE:MMM) added to worries that rising materials costs would erode profit margins.
The Russell 2000 underperformed, closing 0.9 percent lower and erasing all its year-to-date gains. Technically speaking, using the strictest interpretation, all major US indices joined the Russell 2000 in a downtrend.
Why are investors cashing out of small cap stocks, if one of the main headwinds for equities at present is the same trade war that had previously favored these domestically focused companies over their larger cap multinational counterparts? Perhaps, small cap selloffs are justified by the fact that when markets top out, traders shed speculative stocks first. Overall, yesterday’s underperformance of small cap shares adds weight to the evidence of a market top.
As mentioned earlier, all US majors have now registered the second lower trough in a series of descending peaks and troughs, establishing a new downtrend. There is an argument among technicians, however, about what constitutes a valid peak and trough.
While some only consider closing prices, purists examine the entirety of the price action. Yesterday’s lows registered the second trough in a downtrend, but some would argue that the bulls’ ability to push prices back above the previous, October 11 trough, demonstrates strength, and that only a lower close would confirm a lower trough. While conservative traders may wait for that trend reversal confirmation, aggressive traders may act now, relying on the weight of the evidence. Except for the Dow, all major averages closed below their respective uptrend lines since the previous correction February 2016, as well as the 200 DMA.

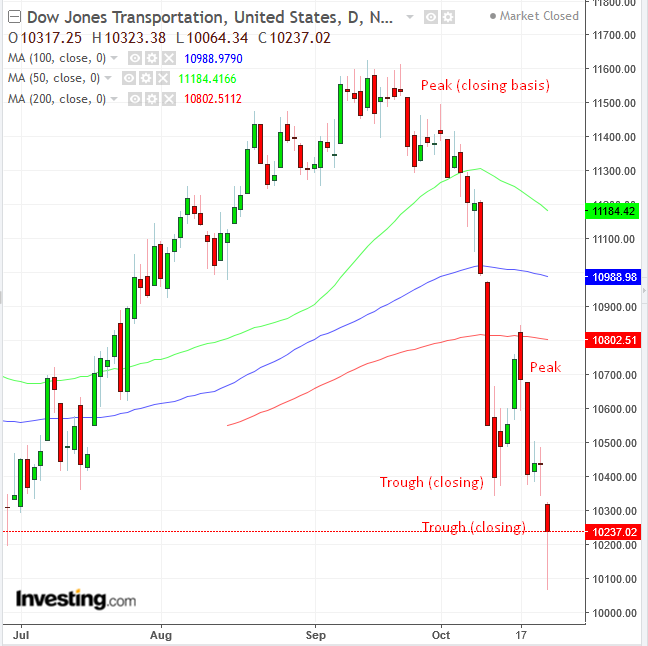
Note, the Dow Jones Transportation index did register a second, lower trough on a closing basis. According to the Dow Theory, when both the Dow Jones Industrial Average and the Transpiration Average confirm a trend reversal on a closing basis, an official reversal has been established.

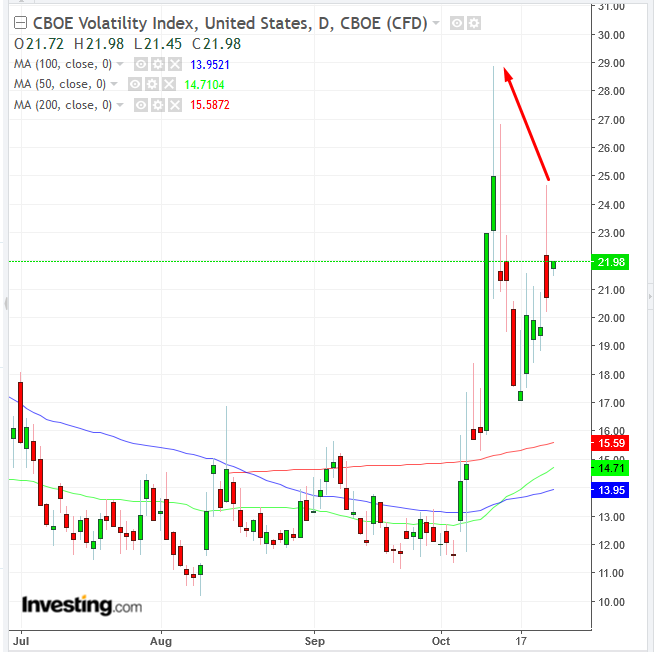
The VIX surged, though it was nowhere near the heights seen during the selloff earlier in the month, suggesting a lack of consensus on future market volatility, and by extension, further declines.

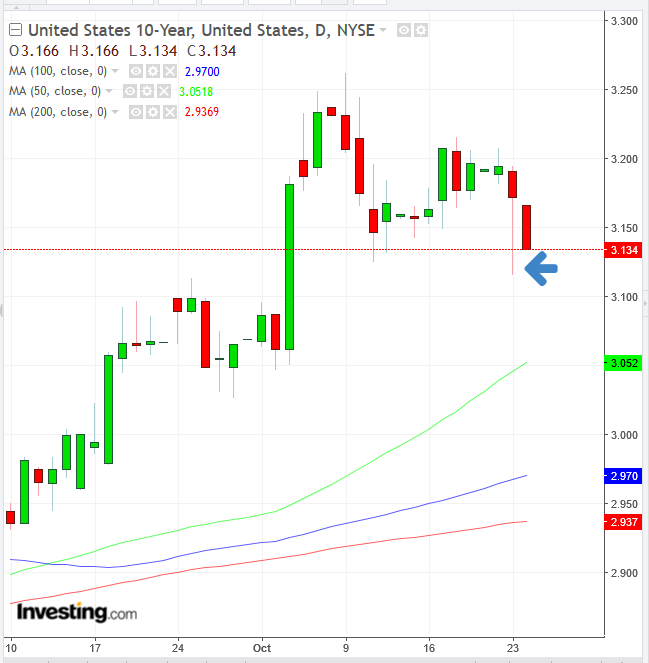
US Treasurys confirm that investors are still in risk off mode, as yields on the 10-year note slipped back below 3.140. They've been trading at the day’s lows during the European morning session, eyeing yesterday’s lows of 3.115.

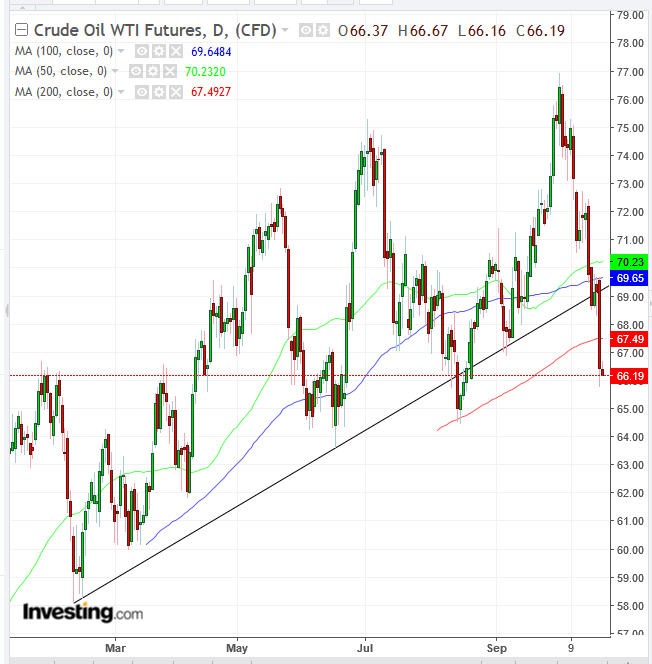
Oil touched the lowest level in almost two months on a pledge by Saudi Arabia to meet any shortfall that may materialize from Iranian sanctions. Technically, the price fell below the uptrend line since February 9, again, as well as below the 200 DMA. The next presumed support is the August 16, $64.43 low.
Up Ahead
- Earnings season rolls on with notable highlights including Twitter, UBS and Total.
- Microsoft (NASDAQ:MSFT), reporting on Wednesday after market close, with a $0.96 estimate, to follow last year’s $0.84 for the same quarter.
- Super Thursday:
- Twitter reports earnings Thursday before market open, with an EPS consensus of $0.05 percent, rising from the same quarter last year’s $0.02 percent
- Amazon.com (NASDAQ:AMZN), scheduled to report Thursday aftermarket, with a $3.29 EPS consensus, compared to the previous year's $0.52 for the same quarter
- Alphabet (NASDAQ:GOOGL), expected to publish results Thursday aftermarket as well, and an EPS forecast of $10.54, compared to $9.57 for the same quarter last year.
- Intel (NASDAQ:INTC), due to release also Thursday aftermarket, analysts expect an EPS of $1.15, after reporting $1.01 for the corresponding quarter last year.
- Monetary policy decisions are due in Sweden and Canada.
- ECB policymakers could on Thursday confirm that asset purchases will end this year, reiterating its pledge to keep interest rates at record lows through summer 2019. President Mario Draghi will hold a press conference.
- U.S. gross domestic product growth may have slowed in the third quarter, yet remained near its best pace since mid-2015, according to forecasts ahead of Friday’s release.
Market Moves
Stocks
- Futures on the S&P 500 Index sank 0.7 percent, hitting the lowest in 16 weeks with its sixth consecutive decline.
- The Stoxx Europe 600 Index jumped 0.4 percent, the first advance in more than a week.
- The U.K.'s FTSE 100 Index rose 0.3 percent, the most substantial advance in more than a week.
- Germany’s DAX Index increased 0.3 percent, the first advance in more than a week.
- The MSCI Asia Pacific Index decreased 0.2 percent to the lowest in more than 17 months.
- The MSCI Emerging Market Index rose less than 0.05 percent.
Currencies
- The Dollar Index climbed 0.33 percent, to the highest since mid-August.
- The euro dipped 0.1 percent to $1.1461.
- The British pound declined 0.2 percent to $1.296, the weakest in three weeks.
- The Japanese yen fell less than 0.05 percent to 112.46 per dollar.
Bonds
- The yield on 10-year Treasuries dipped two basis points to 3.14 percent, the lowest in more than three weeks.
- Germany’s 10-year yield rose less than one basis point to 0.41 percent.
- Britain’s 10-year yield climbed one basis point to 1.477 percent.
- The spread of Italy’s 10-year bonds over Germany’s declined seven basis points to 3.1135 percentage points.
Commodities
- West Texas Intermediate crude decreased 0.1 percent to $66.34 a barrel, the lowest in two months.
- Gold rose 0.1 percent to $1,231.44 an ounce, the highest in three months.
