-
Global stocks take a hit from heated US-China dispute over currency devaluation, persistent EU headaches
-
IMF cuts global growth outlook for the first time since early 2016
-
WTI bulls eye $77 peak
Key Events
Global stocks were mixed on Tuesday, with European shares crawling higher at the open, then slipping into red territory. Futures on the S&P 500, Dow Jones and NASDAQ 100 hovered more markedly in the red, weighed down by re-ignited worries of an escalation of the US-China trade war. Meanwhile, US Treasurys resumed their selloff, pushing the yield on 10-year bonds to fresh 7-year highs, pressuring risk assets yet further.
Miners and oil shares helped the STOXX 600 start Tuesday's session 0.11 percent higher, while a rebound in Italian stocks after yesterday’s sharp fall lifted the FTSE MIB 0.3 percent higher at the open. However, the index not only eased from an early 0.83 percent high, but quickly joined the broader pan-European benchmark in a relatively steep descent.
Earlier, during the Asian session, the Shanghai Composite consolidated with a 0.17 percent gain after yesterday’s 2.78 percent plunge—the worst in more than three months—when traders chose to focus on deepening diplomatic tensions with the US rather than on increasingly attractive stock valuations. The yuan rebounded 0.11 percent after yesterday’s 0.9 percent slide. However, the currency failed to cling to an earlier 0.3 percent gain.
Senior US officials reportedly voiced concerns over China's recent currency devaluation—as much as 9 percent against the dollar—warning they are watching closely for further developments after the People's Bank of China set the weakest daily yuan fixing rate in 17 months on Tuesday.

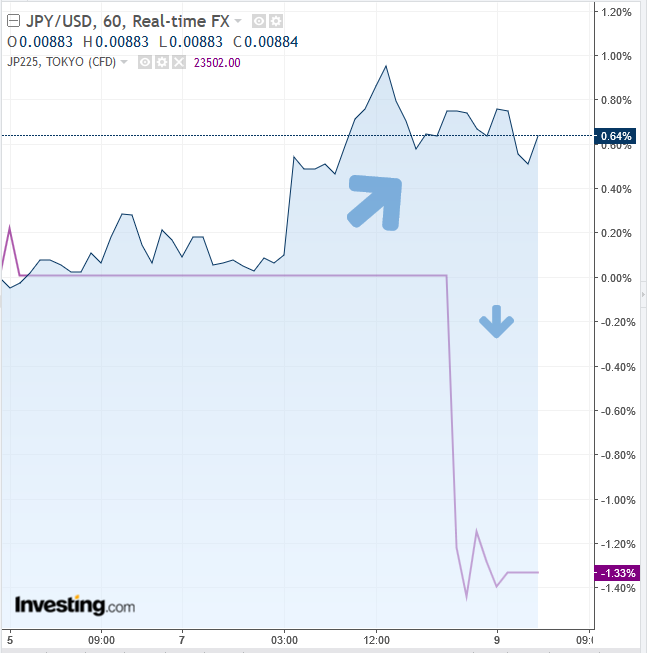
In Japan, the strengthening yen also impacted equities, with stocks of the Nikkei 225's export-reliant firms slipping 1.34 percent lower on aggregate. The yen’s advance then turned into a drop, but it was too late to help Japanese shares gain ground.
Global Financial Affairs
Yesterday's US session saw traders buy into significant early declines. Except for the Dow which closed higher, all major indices closed in the red for the third straight day. As well, it was mainly defensive shares that led the climb, which is not a bullish indication.
The S&P 500 gave up 0.4 percent. Consumer Staples (+1.38 percent) led gains, followed closely by Real Estate (+1.29 percent), demonstrating that the recent selloff was prompted by fears that rising interest rates would depress property valuations and cause mortgages and loans to become unaffordable. Utilities (+0.84 percent) came in third. On the opposite side of the spectrum, Technology (-1.13 percent) was the obvious catalyst for the benchmark's overall decline. Technically, the SPX found support by the August peak, successfully tested with the September trough, at the 2,863 level, which coincides with the bottom of its rising channel since April.
The technology selloff, fueled by losses in software companies and semiconductor manufacturers, pushed the NASDAQ 100 to its lowest level since August 1. Since these stocks are leaders during rallies, momentum traders sell them first. Technically, the price fell below its uptrend line since April, increasing the potential for a further fall to 7,500 and the uptrend line since February.

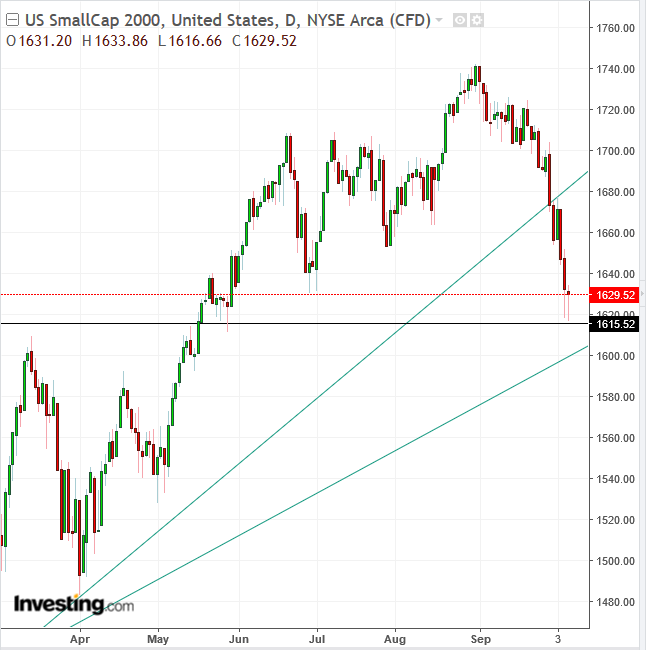
The Russell 2000 dropped 0.16 percent, in a mirror image of the Dow's 0.15 percent climb. This seems to indicate that traders were not concerned with the heightened US-China trade tensions. Technically, the small-cap benchmark is on the verge of a reversal, having registered a lower trough after falling below its uptrend line since February. For now, the index found support by the January and March peaks, which coincided with the longer-term uptrend line since the February 2016 bottom. A rally that would fail to overcome the late-August peak, followed by a fall below the 1,600 level, would establish a reversal.
Meanwhile, the International Monetary Fund cut its outlook for global growth for the first time since 2016—when stocks bottomed—citing the impact of the US-China trade dispute. China's slowing growth complicates the picture, not only because of the country's global weigh as the world's second-largest economy, but also because it can prompt policymakers to step up currency devaluation, which would in turn deteriorate trade relations.
Amid persistent Treasury selling, which is likely to boost the dollar and scare equity investors into further selloffs, traders will now focus on the $230 billion US Treasury auction taking place this week.
In other news, Italy’s 10-year bond yield slipped after spiking on Monday.

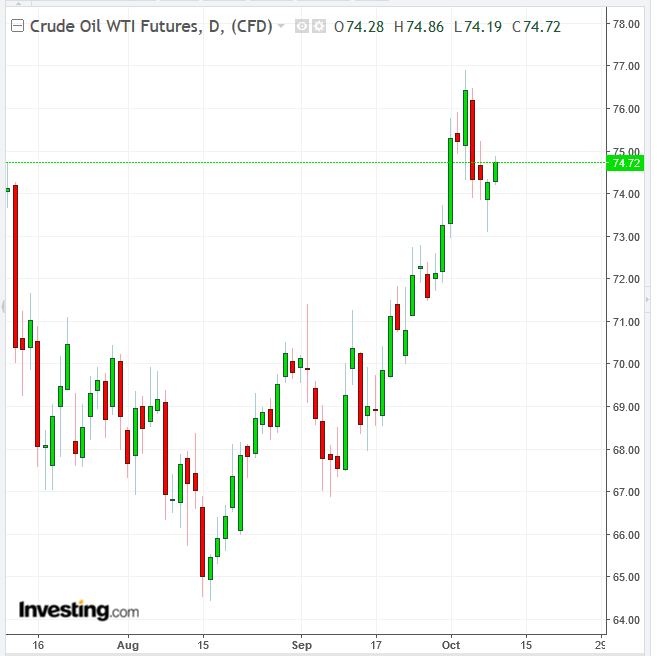
WTI oil climbed toward $75 a barrel. Technically, the advance follows yesterday’s hammer, increasing the odds for traders to push prices up past last week’s near $77 peak.
Iron ore futures in Dalian jumped to the highest level in almost three weeks on higher demand.
Up Ahead
-
The US Treasury auctions $230 billion worth of debt this week.
-
US President Donald Trump holds the latest series of rallies this week ahead of the November 6 mid-term elections.
-
US consumer prices, due on Thursday, are expected to have remained elevated in September, climbing 2.3 percent from a year earlier.
-
JPMorgan Chase (NYSE:JPM), Citigroup (NYSE:C) and Wells Fargo (NYSE:WFC) kick off earnings season for US banks on Friday.
Market Moves
Stocks
-
Futures on the S&P 500 dropped 0.1 to the lowest level in more than four weeks.
-
The UK’s FTSE 100 lost 0.24 percent as of 11.06am GMT.
-
Germany’s DAX gave up 0.41 percent as of 11.06am GMT.
-
The MSCI Asia Pacific Index retreated 0.8 percent, hitting the lowest level in 15 months with its seventh consecutive decline.
-
The MSCI Emerging Market Index fell less than 0.05 percent to the lowest level in almost 17 months.
Currencies
-
The Dollar Index gained 0.17 percent.
-
The euro dropped 0.1 percent to $1.1485.
-
The British pound slid less than 0.05 percent to $1.3088.
-
The Japanese yen eased 0.1 percent to 113.35 per dollar.
Bonds
-
The yield on 10-year Treasuries edged two basis points higher to 3.25 percent, hitting the highest level in more than seven years with its fifth straight advance.
-
Germany’s 10-year yield climbed three basis points to 0.56 percent.
-
Britain’s 10-year yield gained four basis points to 1.714 percent.
-
The spread of Italy’s 10-year bonds over Germany’s slipped six basis points to 2.9813 percentage points.
Commodities
-
West Texas Intermediate crude climbed 0.7 percent to $74.81 a barrel.
-
Gold advanced 0.2 percent to $1,190.85 an ounce.
