- Italian fiscal troubles re-ignite Italiexit fears, overshadows USMCA boost effect on stocks
- Dollar extends rally
- WTI jumps on mounting global supply worries
Key Events
Concerns over the Italian populist government’s fiscal plans this morning overshadowed yesterday’s US-Mexico-Canada Agreement (USMCA), the new version of the former NAFTA deal, putting investors on the defensive. European stocks as well as futures on the S&P 500, Dow and NASDAQ 100 were all flashing red, following their Asian counterparts lower. Meanwhile, the dollar rallied against all major FX peers except for the Japanese yen.
The STOXX Europe 600 took a hit on mounting fears over political instability in Italy—the third largest EU member, contributing roughly 14 percent to the 28-nation bloc common budget. The euro also slipped, hitting its lowest level in three weeks, after the head of the Italian budget committee re-ignited fears of the country's exit from the Union when it commented that the country would have solved its fiscal problems with its own national currency.

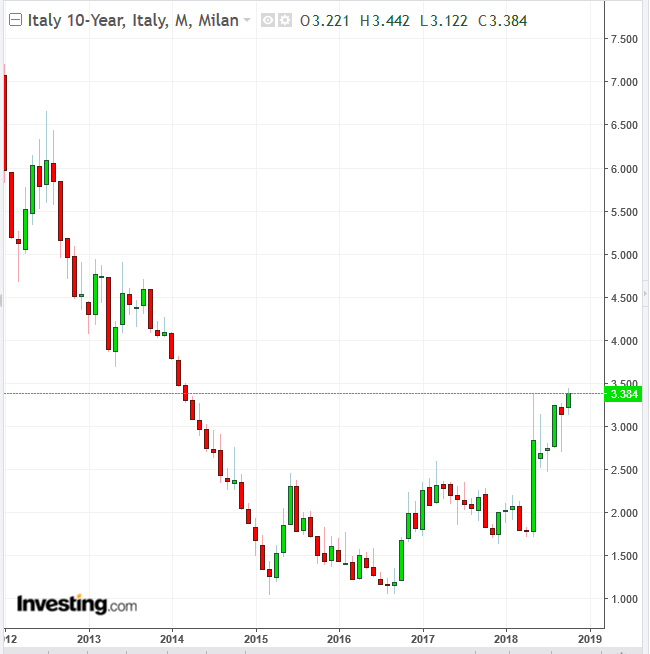
Italian bonds were hit by heightened political headwinds as well, extending a selloff to a fourth day and pushing 10-year yields to their highest level since March 2003.
Earlier, during Asia trade, shares listed on Hong Kong's Hang Seng underperformed, as traders returned from a long weekend. Australia's S&P/ASX 200 and South Korea's KOSPI also closed in the red.
Global Financial Affairs
The widespread risk-off mood seen across global assets today may better reflect the lingering market weakness that was temporarily set aside yesterday, thanks to reports of the new USMCA trade deal. The trade war between the US and China is now back on the front burner, after maritime forces from the two countries faced off in the South China Sea Islands earlier today.
At the same time, the heated political debate about President Trump's Supreme Court nominee, Brett Kavanaugh, may have repercussions in the November congressional elections as well as impact the White House's agenda—thereby also fueling broader market instability. In Monday's US session, stocks ended mixed. Large caps rallied, while small caps fell the most since July after the USMCA trade deal was announced. The greenback rallied against the loonie and the Mexican peso, though it fell against the other FX majors.
While the S&P 500 and the Dow Jones Industrial Average closed higher, most shares hovered in negative territory. Blue-chip stocks outperformed, led by industrial giant Boeing (NYSE:BA). General Electric (NYSE:GE) jumped, after the company replaced its chief executive, and Tesla (NASDAQ:TSLA) leaped forward after CEO Elon Musk settled fraud allegations with regulators.
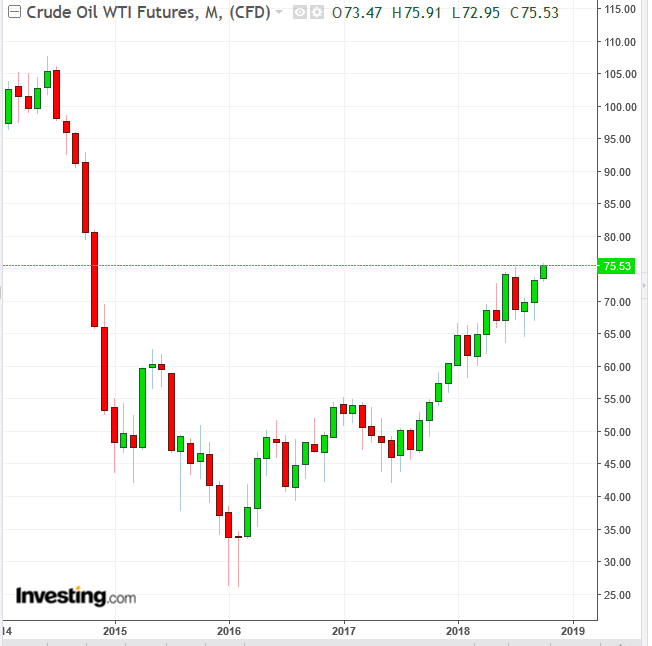
Overall, the SPX gained 0.36 percent, mainly helped by the Energy sector (+1.39 percent), which benefited from oil prices heading towards $76 a barrel and hitting the highest level in almost four years.
Materials (+1.00 percent) and Industrials (0.88 percent) followed suit, helped by the USMCA deal's expected boost to exports. Real Estate stocks (-0.77 percent) underperformed.
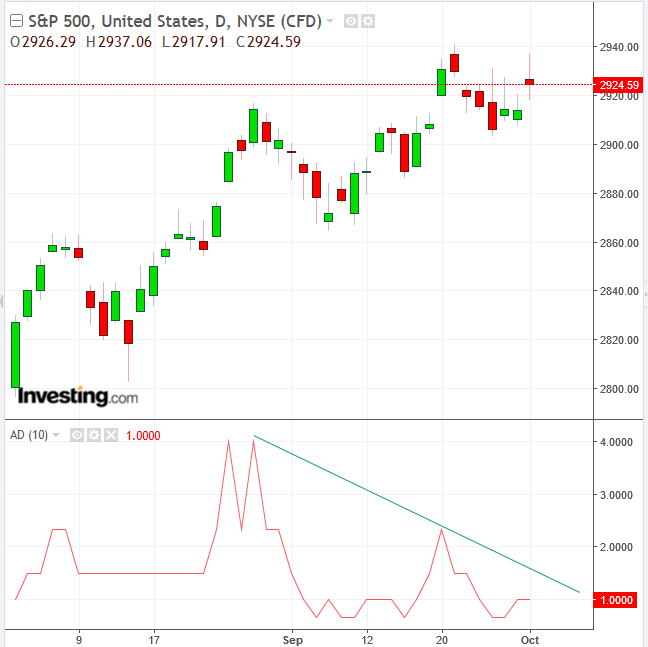
The Dow edged 0.73 percent higher, as multinational companies are set to be the most direct beneficiaries of the new trade deal. The industrial benchmark closed 0.35 percent below its previous closing record, which it hit a week ago Friday. Technically, the Advance-Decline line provides a negative divergence, as it failed to follow prices upward.
After giving up earlier gains of 0.75 percent, the NASDAQ Composite closed 0.11 lower. The early boost had pushed it around 1 percent away from its August 30 record high.
The Russell 2000 underperformed, tumbling 1.35 percent, as investors rotated out of small cap stocks and into large cap shares. The domestic companies listed on the Russell had provided safe haven shelter to investors during the height of the trade jitters.

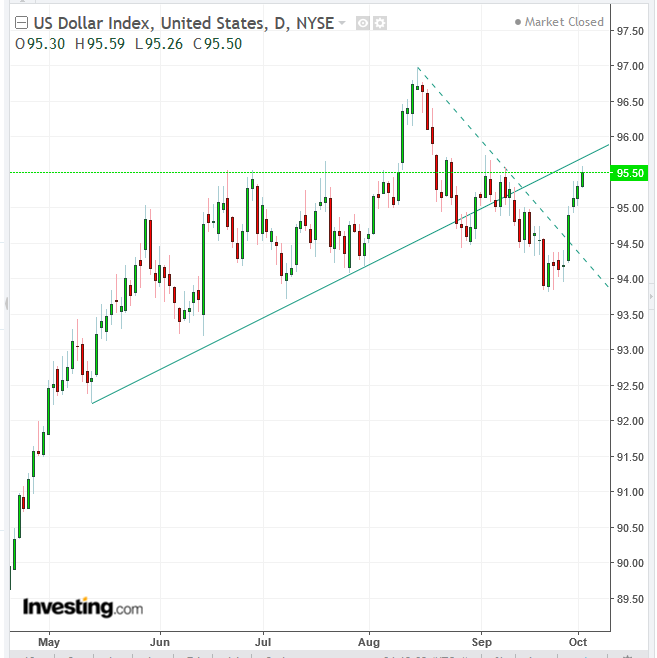
The Dollar Index climbed for a fifth day amid the general risk-off mood. Technically, however, the USD has to prove itself by crossing back above its uptrend line since May. It nontheless managed to extend an advance after crossing above its shorter-term downtrend line since mid-August.
Meanwhile, the Indonesian rupiah slid past 15,000 per dollar for the first time since 1998 after inflation figures came in lower than forecast.

In the oil market, WTI crude held on to gains above $75, its highest level in nearly four years, as reduced US drilling added to supply glitches from Iran and Venezuela. In particular, the looming US sanctions on Iranian oil exports are poised to continue propelling prices higher.
Up Ahead
- UK Prime Minister Theresa May addresses the Tory party conference in Birmingham on Wednesday.
- The US employment report for September is due on Friday.
- Also on Friday, the Reserve Bank of India's monetary policy decision is coming out.
Market Moves
Stocks
- The STOXX Europe 600 inched 0.5 percent lower.
- Futures on the S&P 500 fell 0.3 percent.
- The UK’s FTSE 100 slipped 0.4 percent to the lowest level in more than a week.
- Germany’s DAX slid 0.8 percent to the lowest level in almost two weeks.
- The MSCI Emerging Market Index fell 1.4 percent to the lowest level in almost two weeks on the most significant fall in almost four weeks.
- The MSCI Asia Pacific Index fell 0.7 percent to the lowest level in two weeks on the biggest fall in almost four weeks.
Currencies
- The Dollar Index climbed 0.27 percent, set to close at the highest level in almost a month.
- The euro slipped 0.4 percent to $1.1532, reaching the weakest level in six weeks on its fifth straight decline.
- The British pound retreated 0.4 percent to $1.2996, the weakest level in more than three weeks.
- The Japanese yen gained 0.2 percent to 113.72 per dollar.
Bonds
- The yield on 10-year Treasuries dropped two basis points to 3.06 percent.
- Germany’s 10-year yield lost three basis points to 0.44 percent, the lowest level in almost three weeks.
- Britain’s 10-year yield gave up four basis points to 1.552 percent.
- Italy’s 10-year yield gained 12 basis points to 3.421 percent, the highest level in more than four years.
Commodities
- West Texas Intermediate crude climbed 0.5 percent to $75.66 a barrel, the highest level in almost four years.
- Gold climbed 0.3 percent to $1,192.00 an ounce.
