-
European shares, futures seesaw after Asian, US selloffs
-
EM turmoil prompts rotation out of dollar and into yen, Swiss franc and gold
-
Hong Kong stocks bear brunt of Chinese selling on HKD risk; ASX underperforms
Key Events
Equities in Europe along with futures on the S&P 500, Dow and NASDAQ 100 wavered this morning, after Asian traders remained broadly risk-off, pricing in expectations of weaker growth due to the ongoing emerging markets rout. The flight to safety in the early global open boosted US Treasurys and safe haven currencies.
The region-wide STOXX Europe 600 slipped 0.27 percent lower at the open, dragged down by miners shares. However, it later pared losses, trading in green territory by late morning, to then lose steam again and slide into the red. The benchmark has rebounded from a 3 percent selloff over the last six sessions.
Earlier, during the Asian session, the MSCI Asia Pacific Index edged lower for the sixth consecutive day, losing 1.52 percent. China’s Shanghai Composite dropped 0.47 percent, for an aggregated 3.21 percent over the last eight sessions, since mainland shares started being sold off two days earlier.
The Hang Seng underperformed its mainland counterpart, falling 0.99 percent. China’s traders have cashed out on firms listed in Hong Kong on concerns around the Hong Kong dollar as well as China’s overall economic weakness since the start of the trade war with the US.

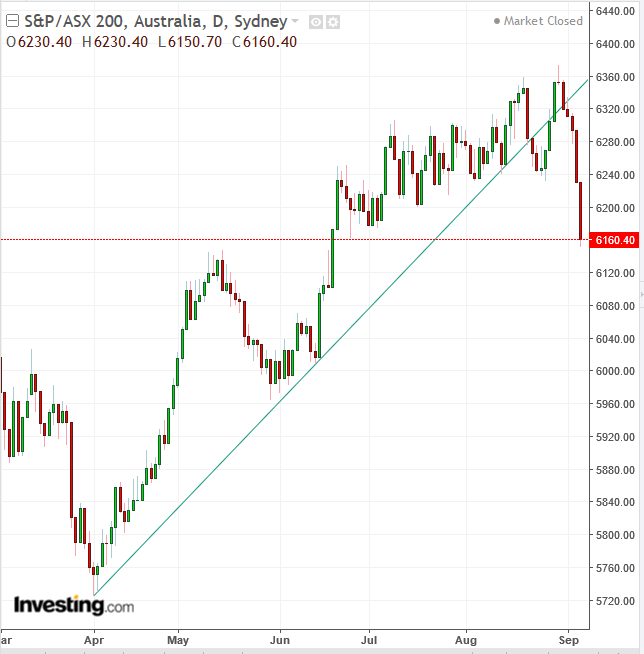
Ironically, Australia’s S&P/ASX 200 lagged its regional peers, posting a 1.12 percent loss, for a 3.02 percent tumble over the last six sessions. The selloff was prompted by the potential of another $200 billion in US tariffs on Chinese goods. The reason it affected Australia’s shares even more than Chinese stocks is that the country’s economy is reliant upon exporting its resources, with China as its largest single buyer. Therefore, a slowdown in the Chinese economy also reduces the outlook for Australia's economic growth.
Technically, the recent selloff pushes prices below their uptrend line since early April.
Japan’s TOPIX slid 0.74 percent lower, for a combined six straight-day 2.71 percent drop. Th index has still managed to outperform the Hang Seng despite typhoon Jebi and harsh weather conditions over the past two months.
Global Financial Affairs
During yesterday's US session, losses in FAANG shares dragged down the broader market after executives from leading tech companies were grilled by regulators on Capitol Hill over the role of social media in Russia's meddling with the US presidential election in 2016.
The NASDAQ Composite tumbled 1.19 percent, the most in three weeks, led by price slumps in Twitter (NYSE:TWTR), Facebook (NASDAQ:FB) and Alphabet (NASDAQ:GOOGL). The heightened regulatory pressure on tech shares added to fears of an emerging markets spillover, prompting investors to cut losses.
The S&P 500 retreated 0.28 percent, dragged down by Communication Services (-1.3 percent) and Technology stocks (-1.25 percent). Utilities (+1.4 percent) and Consumer Staples (1.15 percent) outperformed as investors turned defensive.
The Dow Jones Industrial Average was the only major US index that closed in positive territory, while small caps listed on the Russell 2000 underperformed, dropping 0.33 percent. Once again this demonstrates that it isn’t the trade war that has been driving markets in the latest rout, but rather the overall fear of EM-spurred global selloffs. In times of uncertainty, the stability of mega-cap companies, such as those listed on the Dow, attracts investors while small caps are considered risky.

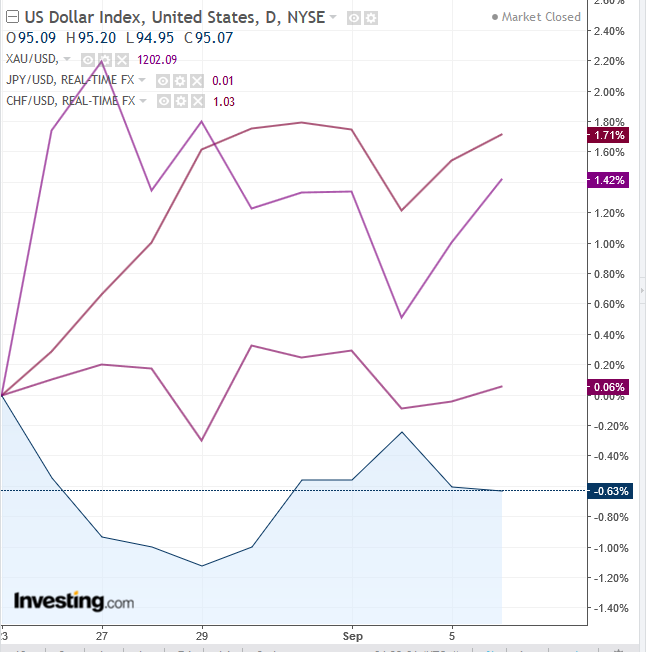
In FX markets, the Dollar Index extended yesterday’s decline, in favor of the more traditional safe haven assets: the Japanese yen, the Swiss franc and gold.
The UK's pound sterling inched higher for a second day after considerable volatility sparked by protracted Brexit discussions. Technically, the current rally may be following the return-move of the GBP's crossing above its downtrend line since April.
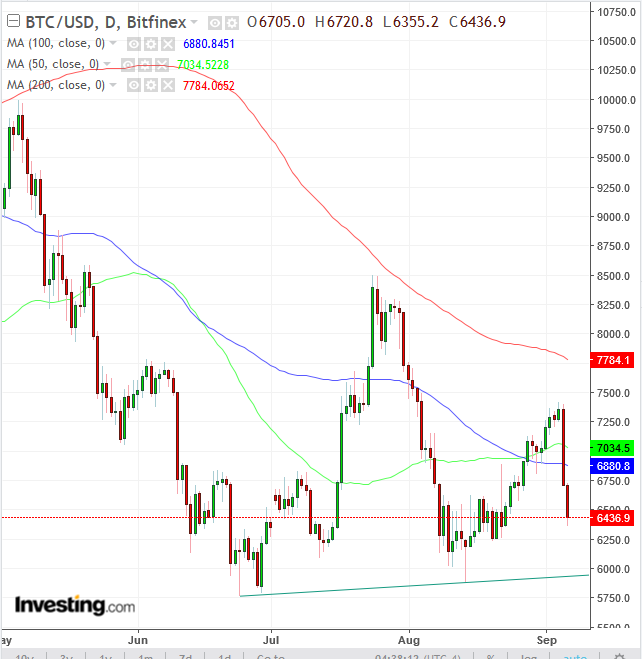
Bitcoin, Ethereum and other alt-currencies plummeted after Goldman Sachs reportedly dropped its plans to open a cryptocurrency trading desk.

Bitcoin is down 4.55 percent today and almost 12.75 percent over the last two days, wiping out two weeks of gains. Technically, the slump happened after the price neared the 200 DMA (red), when it proceeded to fall back below the 50 DMA and 100 DMA.
Up Ahead
-
The public comment period for proposed U.S. duties on an additional $200 billion of Chinese imports expires on Thursday.
-
The key monthly US nonfarm payrolls report for August is due on Friday.
Market Moves
Stocks
-
The STOXX Europe 600 fell 0.3 percent, the lowest level in five months.
-
Futures on the S&P 500 dipped 0.2 percent, reaching the lowest level in more than a week on its fifth consecutive decline.
-
The MSCI All-Country World Index dropped 0.2 percent, hitting the lowest level in more than two weeks with its sixth consecutive decline.
-
The MSCI Emerging Market Index ticked 0.6 percent lower, reaching the lowest level in about 14 months on its seventh straight decline.
Currencies
-
The Dollar index is flat after fluctuating between gains and losses of over 0.1 percent.
-
The euro dropped 0.1 percent to $1.1619.
-
The Japanese yen climbed 0.2 percent to 111.36 per dollar, the first advance in a week.
-
The Turkish lira fell 0.4 percent to 6.6271 per dollar.
-
South Africa’s rand slid 0.5 percent to 15.5037 per dollar, the weakest level in more than two years.
-
The MSCI Emerging Markets Currency Index slipped 0.1 percent to the lowest level in 16 months.
Bonds
-
The yield on 10-year Treasuries fell less than one basis point to 2.90 percent.
-
Germany’s 10-year yield dropped less than one basis point to 0.38 percent.
-
Britain’s 10-year yield gained less than one basis point to 1.404 percent.
-
The spread of Italy’s 10-year bonds over Germany’s climbed 16 basis points.
Commodities
-
The Bloomberg Commodity Index gained less than 0.05 percent.
-
West Texas Intermediate crude fell 0.2 percent to $68.57 a barrel, the lowest level in a week.
-
LME copper climbed 0.3 percent to $5,888.50 per metric ton.
-
Gold gained less than 0.05 percent to $1,197.32 an ounce.
