-
Global equities take a hit from heightened US-China trade spat fears despite strong US GDP reading
-
Gold on track for fifth consecutive negative month
- Dollar rebounds but struggles to climb back above uptrend line
-
Surprise decline in US inventories fails to lift WTI above $70
Key Events
European equities and futures on the S&P 500, Dow and NASDAQ 100 all tumbled into negative territory this morning, after fresh accusations against China by US President Donald Trump dampened investor sentiment and overshadowed upbeat economic data and yesterday's record-setting stock performance in the US.

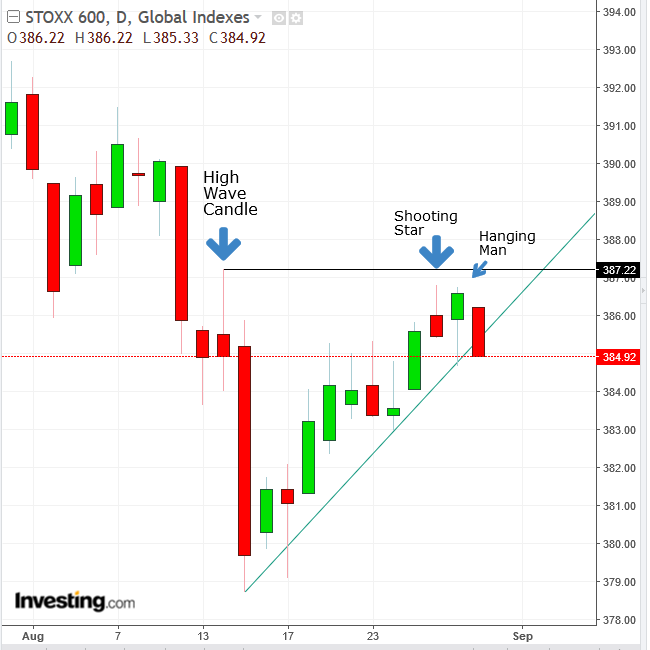
The region-wide STOXX Europe 600 pared about half of yesterday’s advance at the open and then extended losses, dragged down by mining shares. Technically, today’s trade crossed below the uptrend line since mid-August, after yesterday’s hammer reiterated the resistance at this price level. This followed Tuesday’s shooting star, which in turn confirmed the bearishness of the high wave candle posted August 14. Note that a hanging man requires confirmation with a close lower than the hanging man's body.
Earlier, during Asian trade, regional equity indices were mixed. Japan’s Nikkei outperformed, sealing a three-month high on a 0.9 percent climb. In China, trade headwinds weighed on sentiment, with mainland shares on the Shanghai Composite posting an aggregate 1.14 percent slide, followed by Hong Kong’s Hang Seng, the second worst regional performer, which dropped 0.89 percent.
The underwhelming stock performance seen across Asian markets, which is unusual after the repeated and decisive equity record highs posted in the US, underscores the depth of trader fears.
Global Financial Affairs
Yesterday, US stocks hit new records after the second quarter US GDP was revised up to 4.2 percent from 4 percent on imports and software spending, bolstering the most substantial period of growth since 2014. Higher-than-expected imports were the most impressive element, considering recent dollar strength, which makes goods denominated in other currencies costlier.
The technology sector led the rally, helped by Morgan Stanley upgraded its price target for Amazon (NASDAQ:AMZN) to $2500 and for Alphabet (NASDAQ:GOOGL) to $1,515. An additional catalyst was provided by the revised North American trade agreement.
The tech-heavy NASDAQ Composite outperformed after Morgan Stanley (NYSE:MS)'s bullish calls on the two FAANG components, gaining 0.99 percent.
The S&P 500 climbed 0.57 percent, advancing for a forth straight day and closing above the 2,900 level for the first time ever. Even more noteworthy is its close at the top of the session, demonstrating consistency in investor sentiment.
The Dow Jones Industrial Average underperformed its US peers, ticking 0.23 percent higher after swinging between gains and losses. Since it closed off the session's highs, its traders posted less conviction than on other indices, in line with the greater sensitivity, by the mega-cap companies listed on the Dow, to global trade uncertainty. Tensions over the lack of progress in US-China trade negotiations worsened after President Donald Trump accused China of undermining his efforts to convince North Korea to give up its nuclear ambitions.
The Russell 2000 added 0.37 percent.

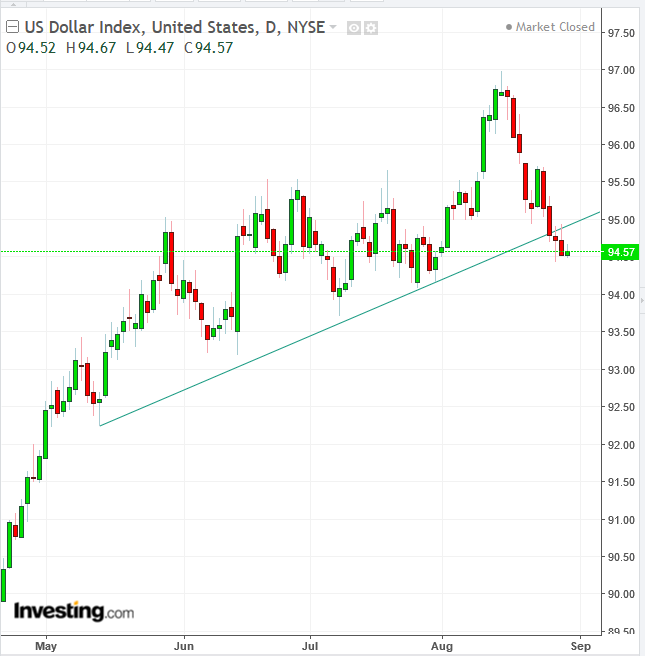
In currency markets, the Dollar Index bounced back but gave up a more significant rebound. It continues to trade beneath its uptrend line since mid-May, for the fourth consecutive session.
The Australian dollar slumped after business investment for the second quarter heavily undershot expectations, while the New Zealand dollar tumbled as business confidence hit a 10-year low. The Indian rupee bounced off an all-time low but is currently edging lower.
Bitcoin slipped lower for a second day, below the $7,000 level, despite news reports that Yahoo Finance has integrated Bitcoin, Ethereum and Litecoin trading.

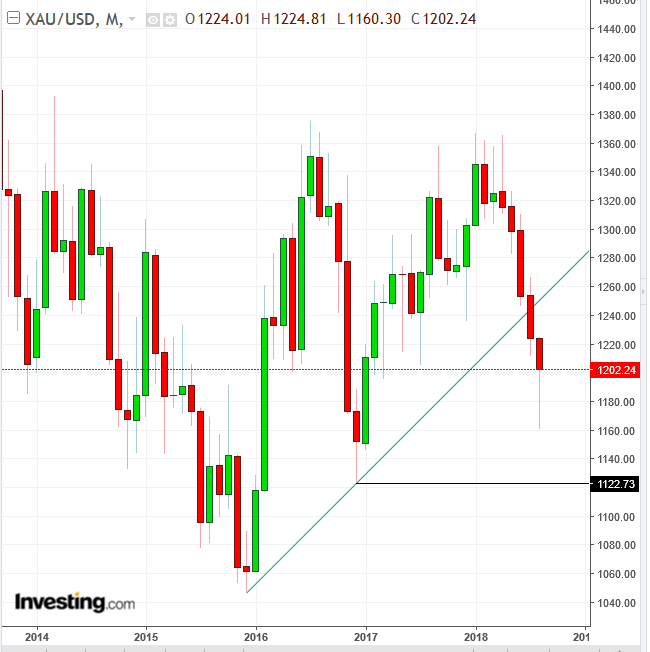
Gold is on track for its fifth consecutive monthly drop, trading lower today. Technically, the precious metal extended its July cross below the uptrend line which has been in place since December 2015. Its next significant support is the preceding long-term trough of $1,122.73, posted on December 2016.

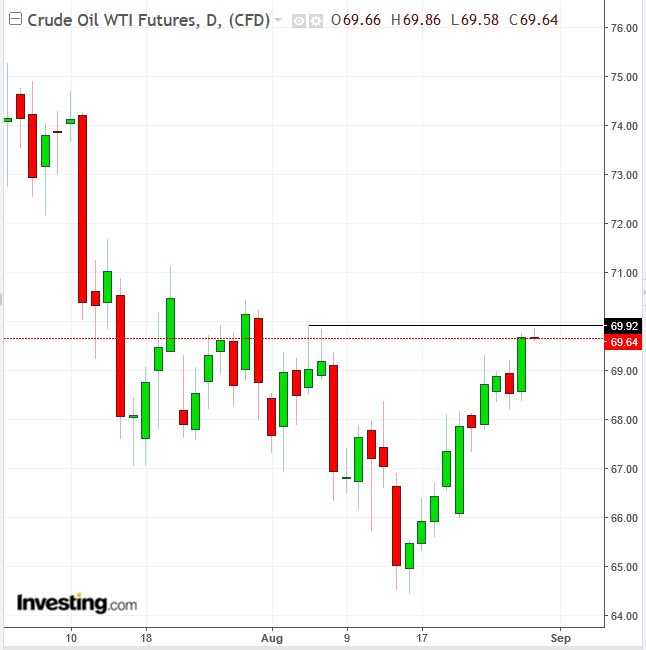
WTI crude slid after giving up earlier gains, falling back below the $70 level, following a bigger-than-expected decline in US crude stockpiles. Should the price close at this level, it would post a shooting star, which would confirm the resistance revealed by two consecutive, preceding shooting starts posted August 6 and 7.
Up Ahead
-
China’s official factory PMI is due on Friday.
-
Also on Friday, the Bank of Korea sets monetary policy. Weak jobs growth has cooled speculation of an interest rate hike.
Market Moves
Stocks
-
Futures on the S&P 500 Index dropped 0.1 percent, the first retreat in a week and the most substantial slide in more than two weeks.
-
The STOXX Europe 600 lost 0.3 percent, the most significant drop in more than two weeks.
-
The UK’s FTSE 100 Index fell 0.5 percent to the lowest level in more than two weeks.
-
Germany’s DAX gave up 0.3 percent, the biggest loss in more than two weeks.
-
The MSCI Asia Pacific Index inched 0.2 percent lower, the first retreat in a week.
-
The MSCI Emerging Market Index fell 0.2 percent, the most significant drop in a week.
Currencies
-
The Dollar Index climbed 0.15 percent, ending a four-day decline.
-
The euro increased 0.1 percent to $1.1714, reaching the strongest level in five weeks on its fifth straight advance.
-
The British pound gained 0.1 percent to $1.3041, the strongest level in more than four weeks.
-
The Japanese yen gained less than 0.05 percent to 111.64 per dollar.
Bonds
-
The yield on 10-year Treasurys slipped less than one basis point to 2.88 percent.
-
Germany’s 10-year yield climbed less than one basis point to 0.41 percent, reaching the highest level in more than three weeks on its fifth straight advance.
-
Britain’s 10-year yield gained less than one basis point to 1.489 percent, hitting the highest level in more than 14 weeks with its fifth straight advance.
-
The spread between Italy’s 10-year bonds over German notes dropped three basis points to 2.6937 percentage points to the smallest premium in more than a week.
Commodities
-
West Texas Intermediate crude climbed 0.4 percent to $69.80 a barrel, the highest level in more than seven weeks.
-
Gold fell 0.2 percent to $1,204.12 an ounce.
