- US-Mexico trade deal boosts global stocks
- USD falls below uptrend line and 50 DMA
- The S&P 500 and NASDAQ hit fresh all-time records
Key Events
Equities in Europe gained ground today while futures on the S&P 500, Dow and NASDAQ 100 meandered, as investors tried to determine the potential impact of the latest developments in global trade. While the news yesterday that the US and Mexico had signed a post-NAFTA bilateral trade deal initially seemed to fall short of impressing US investors, futures contracts this morning were edging higher by intraday European trade, pointing to a clearer and broader improvement in market sentiment.
The STOXX Europe 600 opened 0.29 percent higher, with autos climbing for a second day, helped by yesterday's agreement. Earlier, during the Asian session, Australia’s S&P/ASX 200 outperformed regional peers, gaining 0.57 percent. Hong Kong’s Hang Seng added 0.28 percent and South Korea’s KOSPI ticked 0.17 percent higher.
At the same time, China's Shanghai Composite lagged, retreating 0.1 percent. US President Donald Trump's downbeat remarks on stalled trade talks with China weighed on the mainland index.
Global Financial Affairs
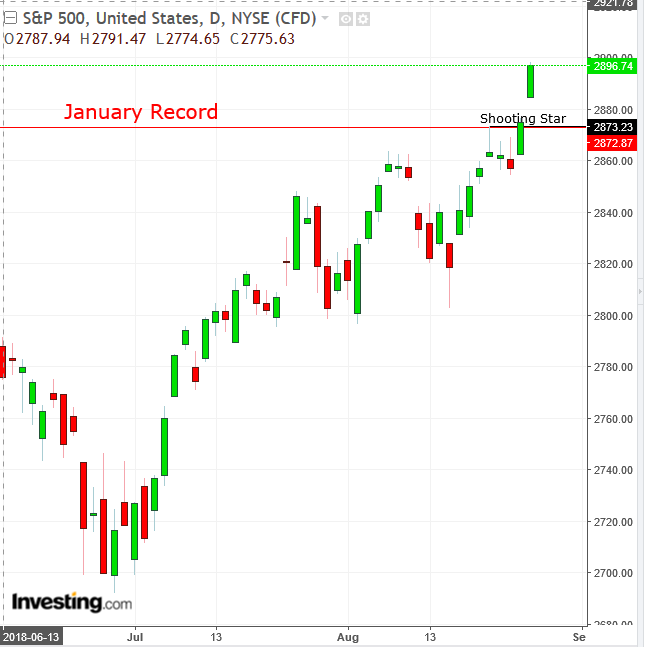
In yesterday's North American session, the S&P 500 jumped 0.77 percent, hitting a fresh all-time high, with a breakaway gap, closing just below the 2,900 psychological round number and pressuring bears who were holding the line of resistance from last Tuesday’s shooting star and January’s record.

The next test for the current S&P rally would be the key 3,000 level. Financials (+1.35 percent) outperformed while Utilities (-0.61 percent) took a hit from the investor shift to risk-on sentiment.
The Dow Jones Industrial Average leaped 1.01 percent, climbing above the 26,000 level for the first time, also with a breakaway gap, overcoming last week’s shooting star and the February peak. The index closed about 2.2 percent below its January record.
The NASDAQ Composite rallied 0.91 percent, topped 8,000 for the first time ever, also on a breakaway gap, clearing the July peak.

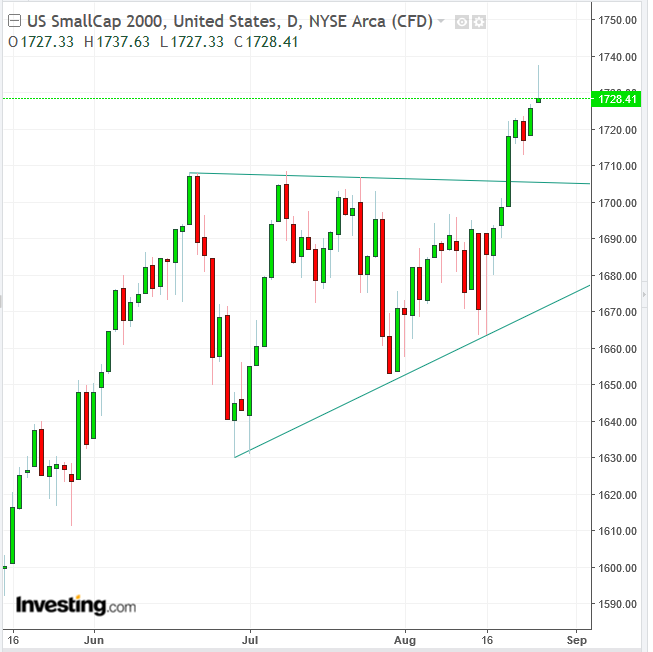
However, the Russell 2000 underperformed its US peers, gaining only 0.16 percent. Although it posted a fresh record high and close, technically the small-cap index gave up most of its gains, forming a shooting star with a very long upper shadow, suggesting a return move to 1700, toward the ascending triangle it had recently completed.
The decisive US equity breakout demonstrates trader bullishness over the US-Mexico deal, after Fed Chair Jerome Powell had already helped investor sentiment on Friday by easing concerns around an accelerated pace of policy tightening. However, lingering uncertainty over the fate of trade negotiations with China, and for that matter Canada, may spoil new-found investor confidence and could weigh on commodities going forward.

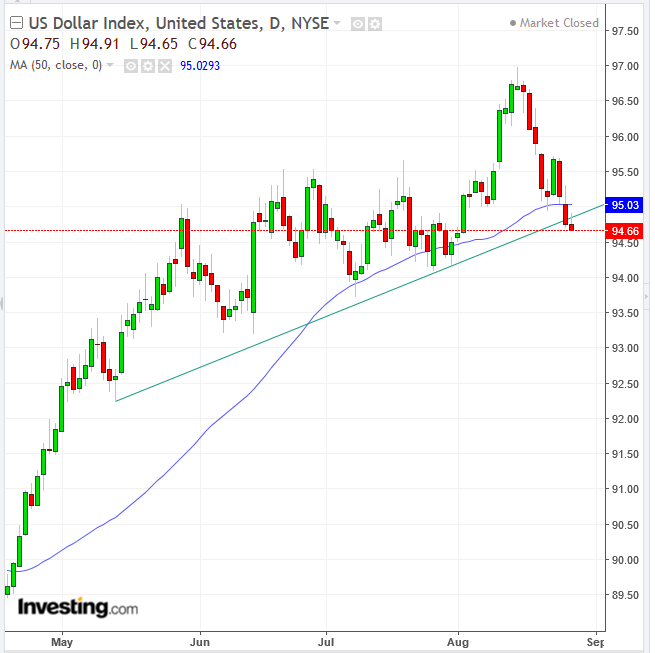
In FX markets, the dollar index attempted a rebound after falling slightly below the uptrend line since May and the 50DMA. However, it's been forced back down.
The Mexican peso crawled higher on the US-Mexico trade breakthrough. The Chinese yuan rebounded after slipping lower on Trump’s underwhelming comments on progress with China. The bounce back was probably sparked by dip buyers, who took advantage of the latest move by the People's Bank of China to strengthen the daily fix against the greenback by the most significant level in more than 14 months.
The Turkish lira extended its decline when the domestic stock market reopened after a bank holiday.

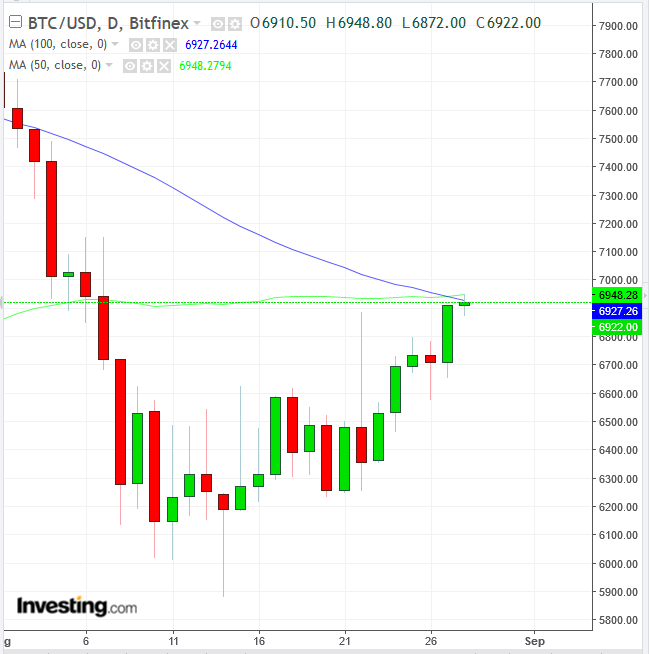
Meanwhile, Bitcoin inched higher for the fourth consecutive session, but failed to hold onto more significant gains, finding resistance in the convergence of the 50 DMA (green) and 100 DMA (blue). Note, however, that the 100DMA just slipped below the 50 DMA, as longer price averages are lower than shorter statistical sets, signaling a higher emphasis on recent price developments. Technical traders consider this a buy signal.
Oil fell below $69 a barrel, fluctuating within a 0.6 percent range, as it failed to overcome Friday’s $69.31 high for a second day. Gold has been moving higher, up 0.27% at time of writing. Traders of the precious metal have noticed what appears to be a surprising new correlation trend for the yellow metal.
Up Ahead
As earnings season winds down with reports due from Best Buy (NYSE:BBY) before the open today and Salesforce.com (NYSE:CRM) on Wednesday, after the close.
Economists expect Wednesday's GDP figures will show the US economy grew at a slightly slower pace in the second quarter.
China’s official Manufactoring PMI is due Friday.
The Bank of Korea sets policy on Friday. Weak jobs growth has cooled speculation of an interest rate hike.
Market Moves
All information provided is accurate as of time of writing
Stocks
The Stoxx Europe 600 gained 0.2 percent, the highest level in almost three weeks.
Futures on the S&P 500 inched less than 0.05 percent higher to the highest level on record.
The MSCI Emerging Market Index advanced 0.3 percent to the highest in almost three weeks.
The MSCI Asia Pacific Index climbed 0.3 percent to the highest in almost three weeks.
Currencies
The Dollar Index climbed less than 0.05 percent.
The euro gained 0.1 percent to $1.1689, the strongest level in four weeks.
The British pound dropped 0.1 percent to $1.2884.
South Africa’s rand slid 0.1 percent to 14.1802 per dollar.
Bonds
The yield on 10-year Treasuries gained one basis point to 2.85 percent, the highest in more than a week.
Germany’s 10-year yield edged less than one basis point higher to 0.37 percent, the highest level in almost three weeks.
Britain’s 10-year yield climbed 18 basis points to 1.451 percent, the highest level in 14 weeks on the biggest gain in five years.
Commodities
Brent crude climbed less than 0.05 percent to $76.22 a barrel, the highest level in seven weeks.
LME copper fell 0.3 percent to $6,084.00 per metric ton.
Which stock should you buy in your very next trade?
With valuations skyrocketing in 2024, many investors are uneasy putting more money into stocks. Unsure where to invest next? Get access to our proven portfolios and discover high-potential opportunities.
In 2024 alone, ProPicks AI identified 2 stocks that surged over 150%, 4 additional stocks that leaped over 30%, and 3 more that climbed over 25%. That's an impressive track record.
With portfolios tailored for Dow stocks, S&P stocks, Tech stocks, and Mid Cap stocks, you can explore various wealth-building strategies.
