Key Events
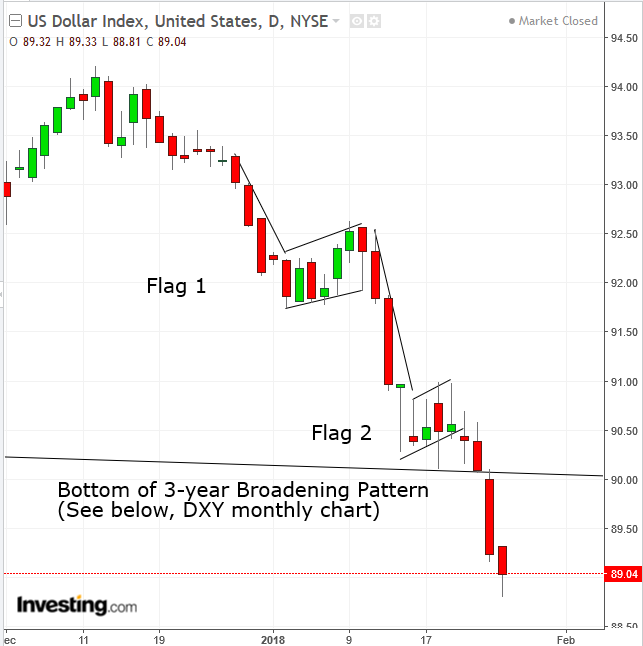
Markets were dominated yesterday by protectionist rhetoric from the Trump administration, thereby extending the dollar selloff for a fourth straight day, driving the currency to its lowest level in three years.
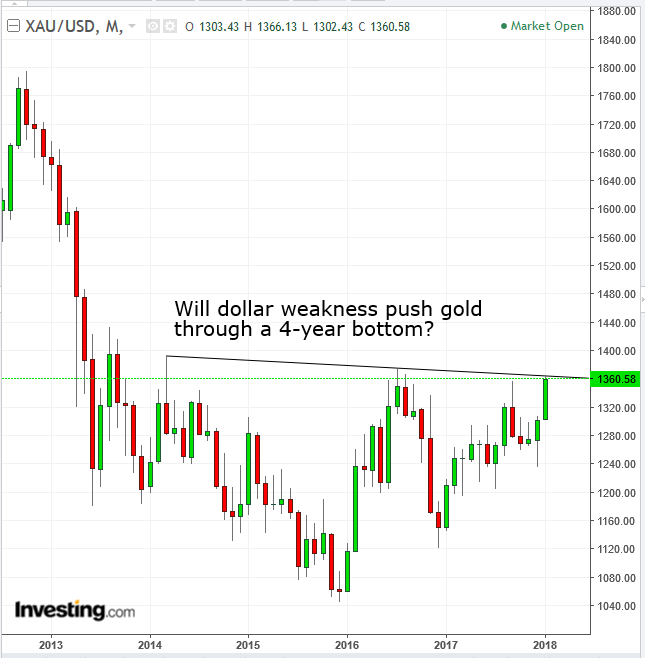
The plunge drove gold higher, pushing the price up against the neckline of a four-year bottom. It also propelled oil to a 3-year high.
On the other hand, stocks in the US whipsawed after opening higher. However, they closed lower, ending a 3 day rally for all major indices except the Dow, which rose higher but still produced a bearish candle.
The S&P 500 opened 0.22 percent higher, then advanced further, to 0.44 percent, as results from General Electric (NYSE:GE) and United Technologies (NYSE:UTX) added to exuberance over the recent tax reform. However, the looming possibility of a trade war—in which US companies would be hit with tariffs in response to the Trump administration recently levying its own tariffs on a list of imported goods—led to a tech selloff, after the sector was already weighed down by poor results from Texas Instruments (NASDAQ:TXN). This weighed on the SPX which fell 0.49 by the close. The up and down whipsawing ranged 0.97 percent, double the price move between open and close.
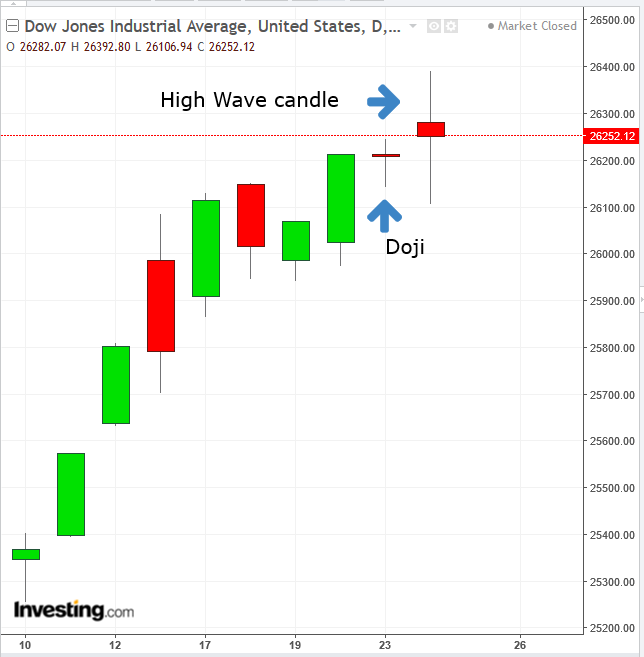
The Dow Jones Industrial Average opened with a 0.26 percent rising gap, extending its gains during the course of the day to 0.69 percent. After the protectionist rhetoric made the news, the index declined by 1.06 percent, but bounced back to close up 0.51 percent from yesterday’s close.
Though it was the only major US index that moved higher yesterday, the 1.06 percent range, of which only 0.1 percent was actually a change between the open and close, indicates a market that has lost its way. The candle that was formed, a small real body (price between open and close) and long upper and lower wicks (price outside the open-close range), is known as High Wave candle. The name is apt; the pattern resembles the image of a man surrounded by high waves in a perilous sea before he drowns, as the price plunges.
The pattern signals a complete lack of market leadership. Which is appropriate right now since savvy traders are no doubt debating whether to buy on robust company earnings, economic growth and the biggest tax reform in 30 years, or to sell on what appears to be a storm on the horizon, a trade war that could decimate earnings and and slow expansion.
The candle follows yesterday’s doji, which was also bearish. We published a more comprehensive analysis here.
The NASDAQ Composite gapped up 0.18 percent, extended gains to 0.64 but finished 0.61 percent lower, producing a Bearish Engulfing pattern, a red candle that completely 'swallows' the preceding green candle.
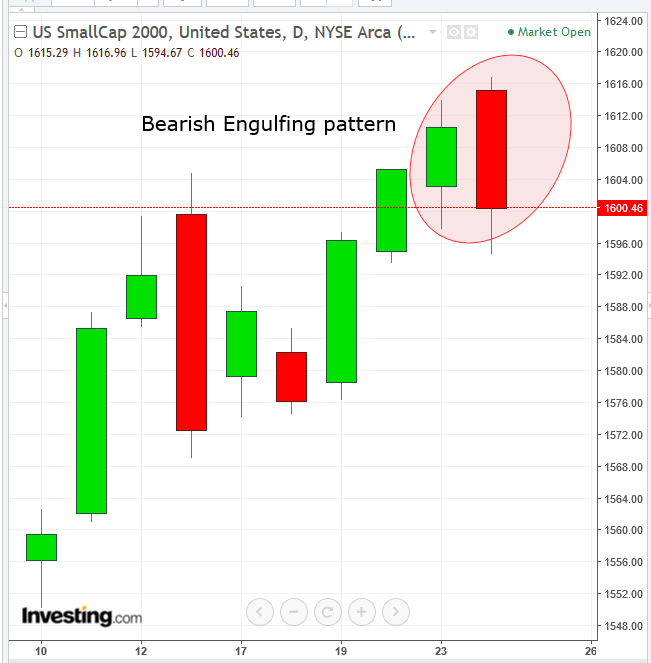
The Russell 2000 was the hardest hit major index yesterday. It opened 0.29 percent higher but closed 0.61 lower than the preceding close. Like the NASDAQ Composite, it produced a Bearish Engulfing pattern, only a more powerful version, making the signal yet more ominous. While the NASDAQ’s Bearish Engulfing pattern was a 0.49 green candle engulfed by a 0.78 red candle, the Russell produced a 0.46 percent range green candle, covered by a 0.91 percent range red candle. This bigger red candle, after a smaller green candle, shows a smaller bullish advance, followed by a bigger bearish one.
Global Financial Affairs
Stocks in Asia fell this morning, as investors couldn’t move past Trump’s protectionist agenda. China’s Shanghai Composite ended a 7-day winning streak.
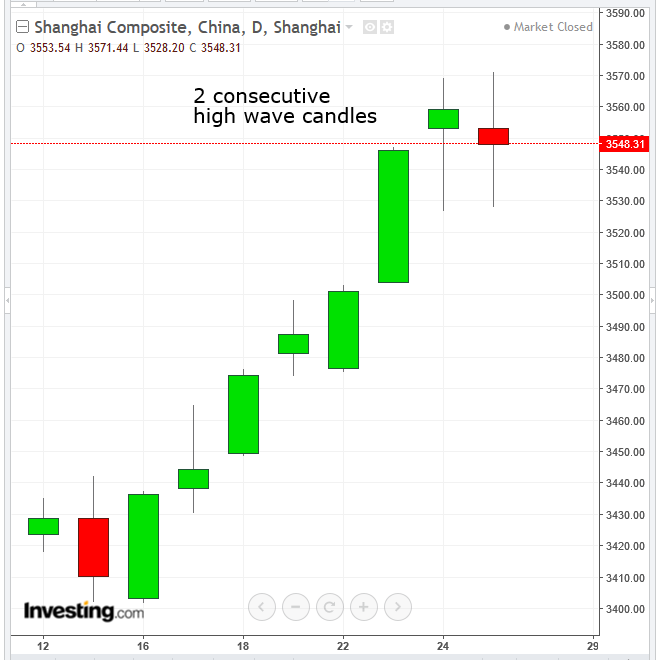
Though the index moved higher yesterday, it also produced a high wave candle. Today, it formed a second one. Hong Kong’s Hang Seng Index completed a bearish engulfing pattern.
Japan’s TOPIX also took a hit, as the yen traded at its strongest level since September, even as the Trump administration wants to weaken the dollar to keep “America First.” That’s got to sting the Japanese leadership. A rising currency/declining equity market correlation can be seen via regional indices as well. The MSCI Asia Pacific posted losses, while the MSCI Emerging Markets Currency Index hit its strongest position on record.
The Stoxx Europe 600 was weighed down by media companies and insurers.
The current market environment highlights the centrality of the dollar to all financial markets. It's the glue of the market structure. Dollar weakness is also boosting commodities. Bloomberg’s index of raw materials is at the highest since October 2015, and gold traded at about the highest in more than a year.
The dollar's slide began even before Donald Trump became president, when, on January 17, 2017, he told the Wall Street Journal that “Our dollar is too strong…and it’s killing us.” Afterward, Steven Mnuchin, both when he was a nominee, as well as after becoming Secretary of Treasury, kept hammering the dollar, saying its strength could hurt growth in the short term.
What's been the upshot of that rhetoric? Since Trump’s inauguration, the euro has moved higher by 15.2 percent, the Danish krone is up 15.1 percent, the pound sterling has gained 13.9 percent, the Swedish krona is higher by 11.3 percent. Additional gainers: the Canadian dollar +7.9 percent; the Norwegian krone + 7.6 percent; the Australian dollar + 6.8 percent; the Swiss franc + 5.2 percent; the yen + 4.7 percent and the New Zealand dollar + 3.2 percent.
And the dollar index keeps falling.
While the international economic community presents a picture of free trade and globalization at the World Economic Forum in Davos, Trump only seems to see competitors for American jobs.
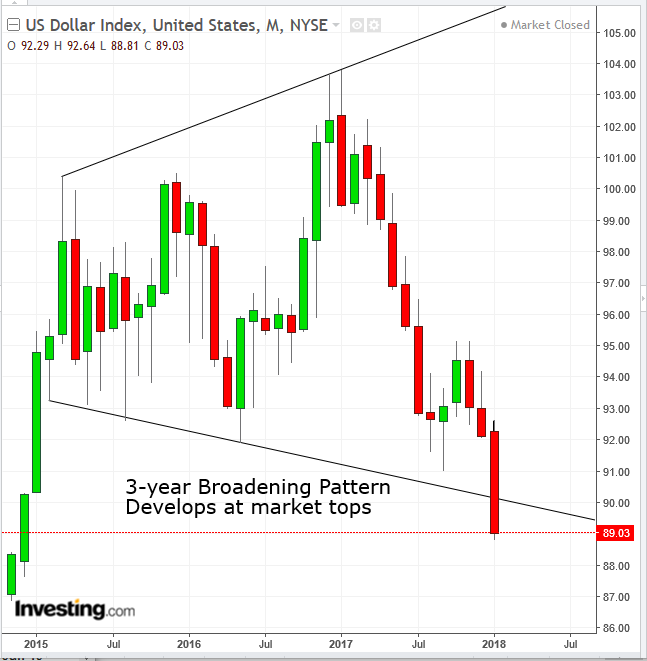
Will 2018 bring another double-digit decline for the dollar index? The price has been trading within a broadening pattern for the past three years. It demonstrates the long-term lack of balance in the market.
In a balanced market the total supply-demand balance provides a coherent outlook. Both buyers and sellers either buy and sell at increasingly higher prices in a rising market or buy and sell at increasingly lower prices in a falling market. In this market, while the buyers have been willing to buy only at lower prices, the sellers have been willing to sell only at higher prices. This indicates a lack of direction, something that appears at market tops.The price has just executed a downside breakout, on an intra-month basis.
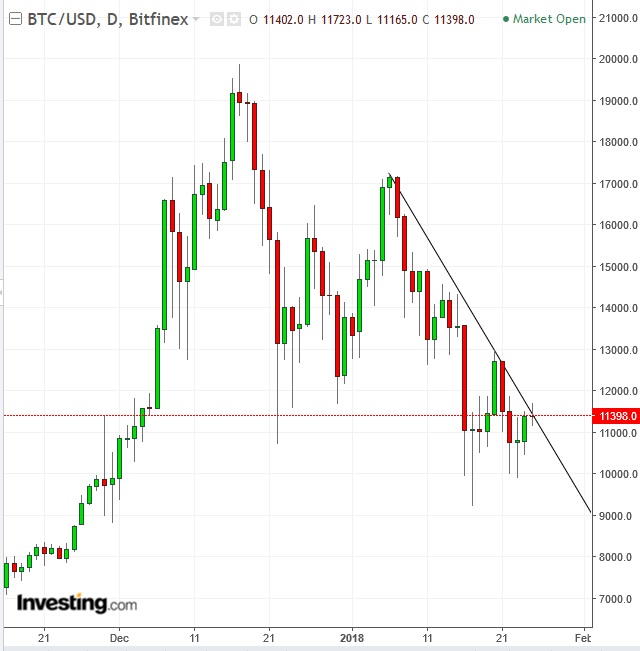
Though Bitcoin apparently escaped a 3 day struggle over the key $10,000 level, the cryptocurrency remains stuck at the downtrend line since January 6.
Up Ahead
- The European Central Bank announces its rate decision today.
- The U.K. House of Lords is considering Prime Minister Theresa May’s Brexit bill this week.
Market Moves
Stocks
- The Stoxx Europe 600 Index declined less than 0.05 percent as of 3:45 London time (8:45 EST), the lowest in a week.
- S&P 500 Futures rose less than 0.05 percent, reaching the highest on record with its fifth consecutive advance.
- The MSCI Asia Pacific Index sank 0.4 percent, the first retreat in a week and the largest decrease in almost six weeks.
- The U.K.’s FTSE 100 decreased less than 0.05 percent to the lowest in four weeks.
- The MSCI Emerging Markets Index increased less than 0.05 percent, hitting the highest in more than 10 years with its 10th straight advance.
Currencies
- The Dollar Index decreased 0.16 percent, paring an earlier 0.48 percent drop.
- The euro dipped less than 0.05 percent to $1.2402.
- The British pound gained 0.2 percent to $1.4264, the strongest in 19 months.
- The Japanese yen rose less than 0.05 percent to 109.19 per dollar, the strongest in almost 20 weeks.
- South Africa’s rand sank 0.7 percent to 11.9383 per dollar, the biggest dip in more than two weeks.
- The MSCI Emerging Markets Currency Index jumped 0.5 percent to the highest in more than six years on the largest climb in more than 15 weeks.
Bonds
- The yield on 10-year Treasuries decreased one basis point to 2.64 percent.
- Germany’s 10-year yield dipped one basis point to 0.58 percent, the largest decrease in more than a week.
- Britain’s 10-Yyear yield was unchanged at 1.407 percent, the highest in about a year.
Commodities
- West Texas Intermediate crude climbed 1.1 percent to $66.35 a barrel, the highest in almost three years.
- Gold declined less than 0.05 percent to $1,358.19 an ounce, the first retreat in a week and the biggest drop in more than a week.
