Key Events
Yesterday, US stocks took off from Tuesday’s highs, and all four major indices extended gains to fresh records. The moves were driven by the Fed Minutes headline that policy makers remain on course for three additional rate hikes this year, as well as the ISM Manufacturing PMI release showing that US manufacturing expanded in December at the fastest pace in three months.
The S&P 500 jumped 0.64 percent, with a rising gap—as there were only buyers and no sellers between Tuesday’s 2,695.89 high and Wednesday’s 2,697.77 opening price. This turned out to be also the lowest point of the day, as traders kept bidding up the price without ever looking back. The S&P also crossed over the 2,700-psychological round number for the first time.
The Dow climbed 0.40 percent, with no gap. The supply-demand equation here was more balanced.
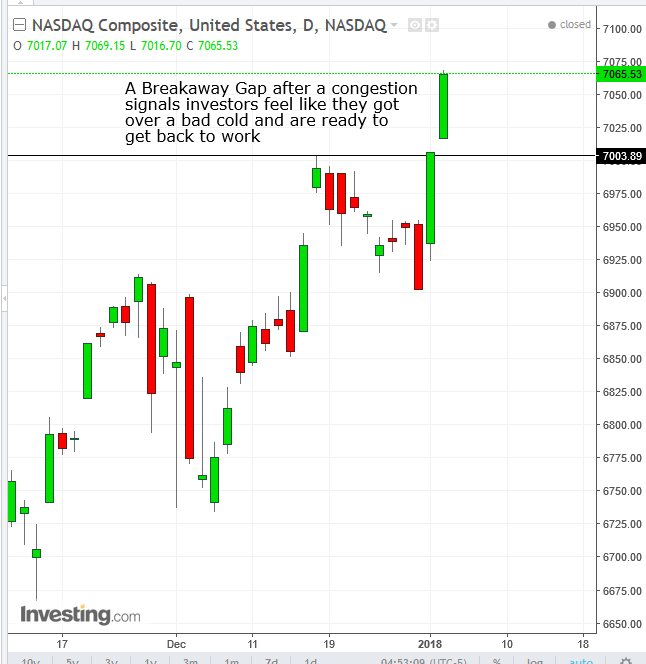
The NASDAQ Composite, like the SPX, gapped up though even higher, +0.84 percent.
Once again it was the Russell 2000, the index of small cap, domestic companies, that lagged—both in its almost flat 0.02 percent advance, as well as in its ability to overcome supply pressures.
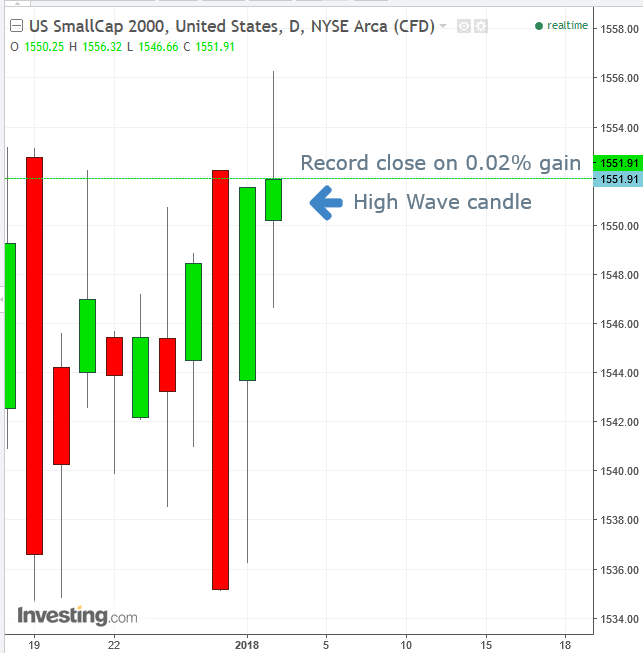
Like the Dow, it didn’t gap up since there were in fact sellers, but unlike the Dow it failed to post a record high, only a record close. As well, it formed a High-Wave candle, in which it traded much higher and much lower but closed near the opening price.
This volatility illustrates investor indecision about the value of the index. They simply can’t make up their minds whether it should be bought or sold. This, of course, raises the risk of a reversal. Unlike the mid-range candle formed the previous Wednesday, after already retreating from record highs, yesterday’s high-wave candle formed at the top of the range, after posting a fresh record close, rendering the psychological makeup of the candle significant.
Nevertheless, this indecisive session, on a record high, underscores our often repeated question: domestic companies are expected to be the biggest beneficiaries of the recently implemented tax cuts, why then is their index falling behind the other benchmarks?
Global Financial Affairs
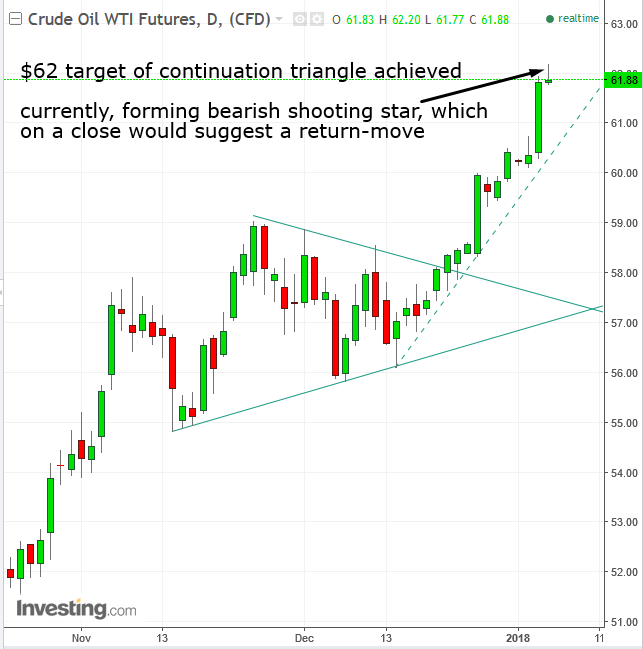
West Texas crude approached $62 a barrel yesterday, for the first time in three years, surpassing a crucial threshold for expanding new shale drilling. The price closed at $61.84, beating the previous highest close since the 2014 crash, posted June 2015 at $61.43. The highest price since the crash was registered intraday on May 6, 2015 at $62.58. A penetration of that price would signal a potential bottom.
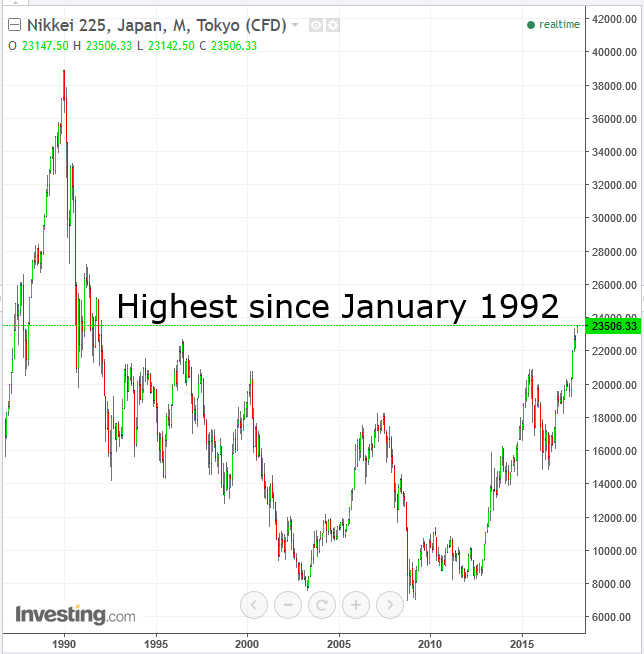
This morning, the MSCI Asia Pacific Index headed for a record close after the TOPIX and the Nikkei 225 in Tokyo closed at their highest in more than a quarter century.
The Stoxx Europe 600 opened with a rising gap and extended its advance by 0.50 percent, its biggest gain in two weeks, led by builders and car makers, with most sectors showing green. Investor confidence grew after data released yesterday by Germany indicated that unemployment fell to the lowest level in 27 years as exports surged and consumer spending rose.
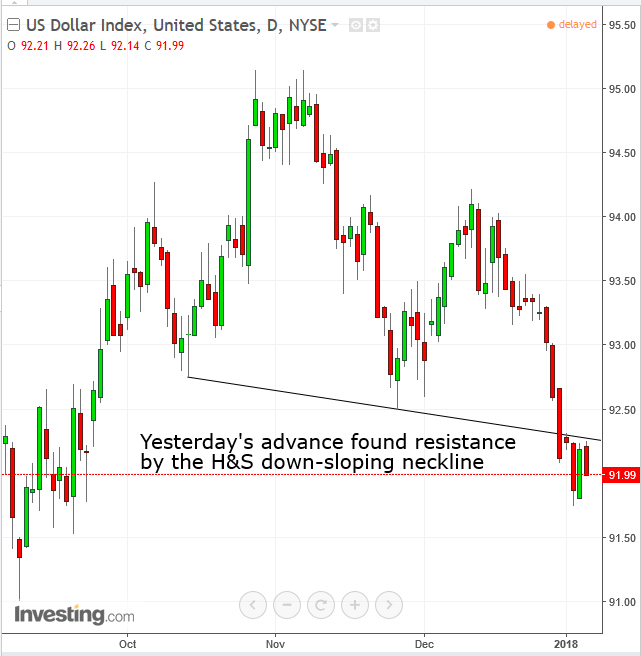
After the dollar moved higher yesterday on the release of the FOMC Minutes confirming that rate hikes are on track as planned, today the dollar retreats, as most European bonds pare yesterday’s gains and the euro advances toward a three-year high.
While most policy makers voted for the December rate hike, as well as “continuing gradual approach to raising the target range” for the benchmark policy rate, “several (officials) expressed concern that persistently weak inflation may have led to a decline in longer term inflation expectations.”
We italicized the term “several,” as this is the first time it is used in this context, to the best of our recollection. This creates a sense that confidence in a return of inflation is slipping, syncing with our ongoing coverage on the market structure divergence, in which investors have been increasing demand for Treasury yields in a statement of their lack of faith regarding rising rates and in turn higher yields. The FOMC has made no progress in understanding the inflation conundrum. As well, they remain divided on the risks of the new year.
Investor sentiment during the first week of the new year has been buoyed by bullish economic data from the US, Europe and China. As a result, many stocks and commodities—boosted further by a weak dollar—have extended gains from 2017. Bond yields have begun to tick higher.
Investors in Europe will be keeping a nervous eye on volume following the introduction of a slew of new regulation across eurozone.
Up Ahead
- Data on Thursday will include U.K. house prices, services PMIs for Spain, Germany, France, the U.K. and the eurozone among others. The U.S. session features St. Louis Fed President James Bullard delivering a keynote address in Philadelphia and ADP employment data
- U.S. December employment data is due on Friday.
- India releases an estimate for 2018 economic growth Friday.
Market Moves
Stocks
- The Stoxx Europe 600 Index gained 0.5 percent as of 9:13 London time (4:13 EST) and the biggest rise in two weeks.
- The MSCI All-Country World Equity Index advanced 0.4 percent to the highest on record.
- The U.K.’s FTSE 100 gained 0.3 percent.
- S&P 500 Futures increased 0.1 percent to the highest on record.
Currencies
- The Dollar Spot declined 0.13 percent.
- The euro gained 0.1 percent to $1.2033.
- The British pound advanced 0.2 percent to $1.3545.
Bonds
- The yield on 10-year Treasuries gained two basis points to 2.47 percent, the highest in more than a week.
- Germany’s 10-year yield increased one basis point to 0.46 percent.
- Britain’s 10-year yield dipped seven basis points to 1.213 percent, the largest dip in more than three weeks.
Commodities
- The Bloomberg Commodity Index gained 0.1 percent, hitting the highest in almost 11 months with its 15th straight advance.
- West Texas Intermediate crude advanced 0.4 percent to $61.87 a barrel, the highest in more than two years.
- Copper advanced 1.1 percent to $7,229.00 per metric ton, the largest gain in more than a week.
- Gold dipped 0.1 percent to $1,312.43 an ounce.
