Monday October 1: Five things the markets are talking about
Canada’s loonie, the Mexican peso, along with North American stock futures have gained overnight after the US and Canada confirmed a deal to save the ‘old’ Nafta, now named USMCA – United States, Mexico, Canada agreement.
In Asia, trading volumes were below normal overnight, with Labor Day in Australia, Hong Kong shut and China out through Oct. 7.
However, data from China over the weekend showed that the manufacturing sector weakened in September as domestic and export demand softened. Their manufacturing PMI reading fell to 50 – a strong reminder that the trade disputes are starting to have real consequences on China’s economy.
In Japan, the tankan survey showed business confidence among Japan’s big manufacturers has worsened in the September for the third quarter in a row.
Elsewhere, on the central bank front, the Reserve Bank of Australia (RBA) is expected to leave its monetary policy unchanged at +1.5% (Oct 2), while the Reserve Bank of India (RBI) is to potentially hike to support a weakening INR (Oct 4). Throughout the week, the final manufacturing and services PMI’s for September will be posted.
North American employment data will close out the week with Friday’s US non-farm payroll (NFP) and Canada jobs report (Oct 5).
1. Stocks mixed start
Emerging markets began Q4 in a mixed mood as signs of weakness in manufacturing activity in China limited the optimism from a revamped USMCA deal.
Japan’s Nikkei share average rallied to a near three-decade high overnight, as an extended weakening in yen (¥114) helped improved export earnings for Japanese corporations. The Nikkei ended the day up +0.52%, its strongest since November 1991. The Nikkei has rallied +7% since the beginning of September, supported by the yen’s depreciation and buying by foreign investors.
Note: The Bank of Japan’s quarterly “tankan” survey of business sentiment showed big manufacturers saw the dollar averaging $107.40 yen for the 2018/2019 financial years.
Down-under, Aussie stocks slipped to their lowest close in a fortnight in a lightly traded session overnight as financial again slipped pressured by scathing interim findings of a high-profile inquiry into the sector. The S&P/ASX 200 index fell -0.6%. In S. Korea, the Kospi stock index fell on Monday, amid muted broader Asian peers, as foreign investors trimmed their equity exposure. The index was down -0.18%.
Note: Chinese markets were closed for a public holiday.
In Europe, Italy’s FTSE MIB index has rallied +0.5%, regaining some of Friday’s steep losses (-3.7%) on news that the country’s anti-establishment government had widened its budget-deficit target.
US stocks are set to open deep in the ‘black’ (+0.6%).
Indices: Stoxx50 +0.6% at 3,421, FTSE 100 +0.1% at 7,520, DAX +0.7% at 12,335, CAC 40 +0.4% at 5,513, IBEX 35 +0.6% at 9,448, FTSE MIB 1.5% at 21,021, SMI +0.3% at 9,118, S&P 500 Futures +0.6%
2. Brent oil hits four-year high ahead of Iran sanctions, gold lower
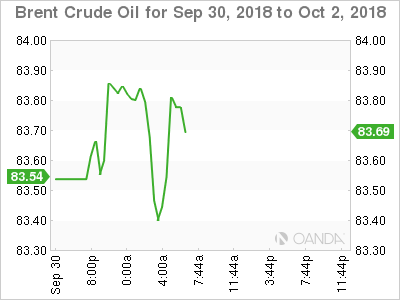
Oil prices have gained, with international benchmark Brent hitting a four-year high, as US sanctions on Tehran squeezed Iranian crude exports, tightening supply even as other key exporters increased production.
Note: Sanctions against Iran – will start targeting its oil sector from Nov. 4.
Brent crude oil futures are at +$83.09, up +36c, or +0.4% above Friday’s close. US West Texas Intermediate (WTI) crude futures are up +19c, or +0.3%, at +$73.44 a barrel.
WTI is supported by Friday’s report of a stagnant rig count in the US, which could suggest a slowdown in US crude production.
Over the weekend, it was reported that President Trump called Saudi Arabia’s King Salman on Saturday to discuss ways to maintain sufficient supply once Iran’s exports are hit by sanctions.
Note: It’s expected that -1.5m bpd of Iranian oil is effectively going offline on Nov. 4.
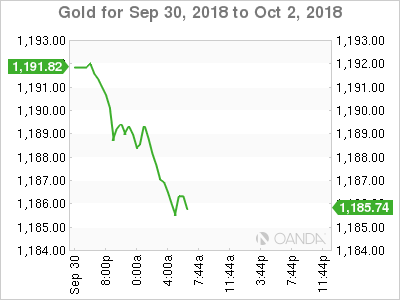
Ahead of the open, gold prices have dipped as the ‘big’ dollar firms against G10 pairs in the wake of indications from the Fed last week that it will pursue a tighter monetary policy – after hiking rates +25 bps, the Fed said it has planned for four more increases by the end of 2019 and another in 2020.
Spot gold is down -0.5% at +$1,186.29. On Friday, gold touched its lowest since Aug. 17 at +$1,180.34 an ounce. US gold futures have slipped -0.5% to +$1,190.60 an ounce.
3. Italian bond yields extend last week’s rise on budget concerns
Italian bond yields have aggressively backed up this morning, extending last week’s move, as a news report suggested Italy’s budget proposal was to be rejected by the European Commission.
Italy’s 2-Year BTP bond yield has surged +18 bps to +1.23%, while the yield on its longer 10-year BTP bond was up +9 bps at +3.24%, while the premium investors demand for holding Italian paper over German Bunds is +274 bps, having been as tight as +225 bps last week.
Elsewhere, the yield on US 10-Year Treasuries has climbed +1 bps to +3.07%, while the yield on the 2-year note increased +1 bps to +2.82%. Germany’s 10-year Bund yield has gained +1 bps to +0.48%.
4. Dollar finds some traction, but risk back in vogue
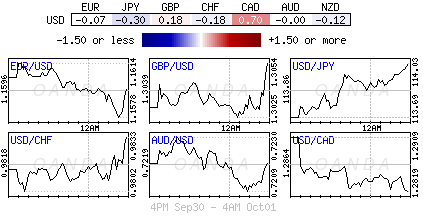
With USMCA delivered, its no surprise to see the respected countries currencies strengthen a tad. The MXN has gained +0.9% to $18.548, the strongest in almost two-months and on the biggest rise in more than a fortnight. The CAD has climbed +0.75% to C$1.2800, the strongest in five-months.
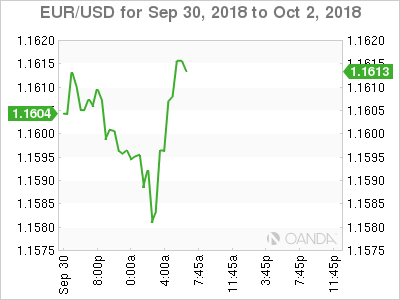
The EUR (€1.1614) continues to be dogged by worries about a rise in Italy’s fiscal deficit after the Italian government agreed to set a higher than expected budget deficit target that could put Italy on a collision course the European Commission.
The Japanese yen has fallen -0.2% to ¥114, the weakest in about 11-months.
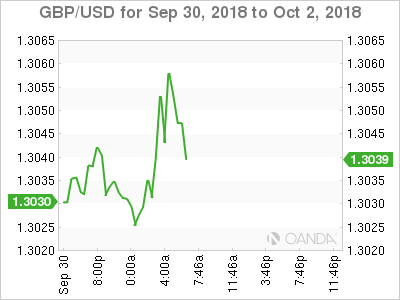
5. U.K consumer borrowing rose last month
Data this morning showed that the U.K consumer borrowing on credit cards increased in August, suggesting another month of growth in spending.
Bank of England (BoE) data showed borrowing on credit cards and other unsecured forms of lending rose to +£1.1B from +£0.8B in July. The market was expecting a headline print of +£1.4B.
British consumer borrowing climbed, too, with banks lending +£4B to consumers in August, net of repayments, up from GBP3.8 billion in July, in a further signal of steady growth in household spending.
The number of new home loans approved by lenders in August also rose slightly compared with July, to +66,440.
Other European data showed that the final Eurozone manufacturing PMI’s for September was revised slightly lower to 53.2 from 53.3 in the flash reading and down from 54.6 in August.
Markit highlighted that exports rose only slightly, which weighed on total orders growth as well as production, with global trade concerns pushing confidence down to a near three-year low.
