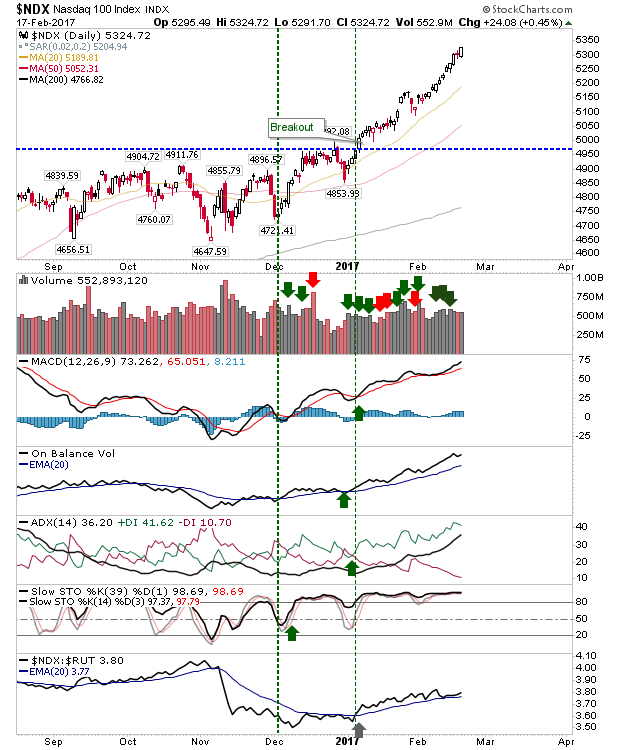
Last week was another week of strong gains for the market, but it was the NASDAQ 100 which has really shone since the start of the year. The NASDAQ 100 now sits 11.8% above its 200-day MA, with all technicals firmly in the green. The +DI line is at an extreme which is often associated with a reversal, although these reversals can be brief, as it was in November.
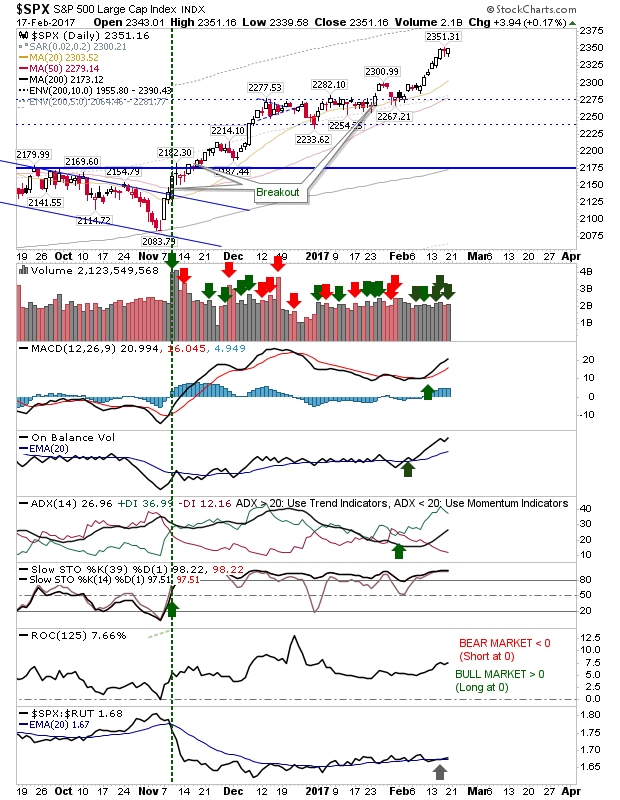
The S&P also finished last week near highs, but its relative performance has slowed - which isn't necessarily bad as it marks rotation towards more speculative (and long-term bullish) stocks.
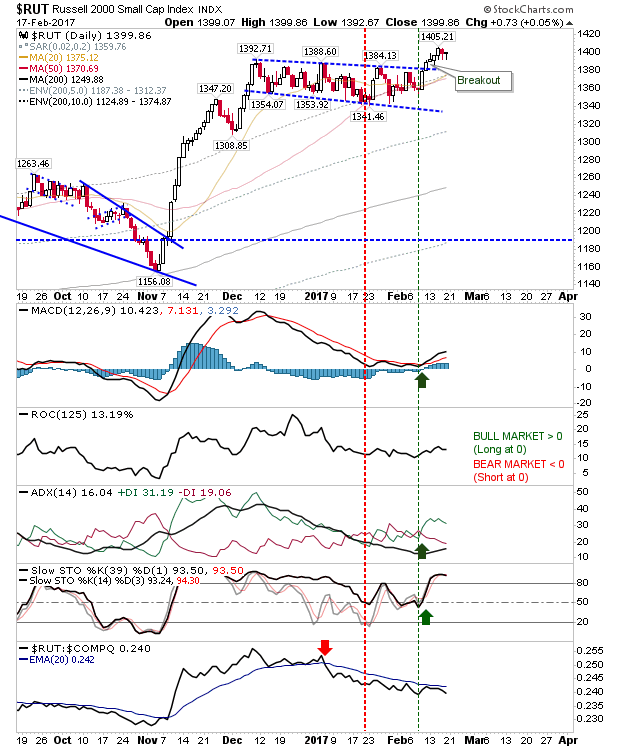
However, these speculative issues don't look to be part of the traditional bull market leader, the Russell 2000, which is a concern. The relative performance of the index has suffered throughout 2017, which needs to change if Tech indices end up going south - leaving the bull market high and dry.
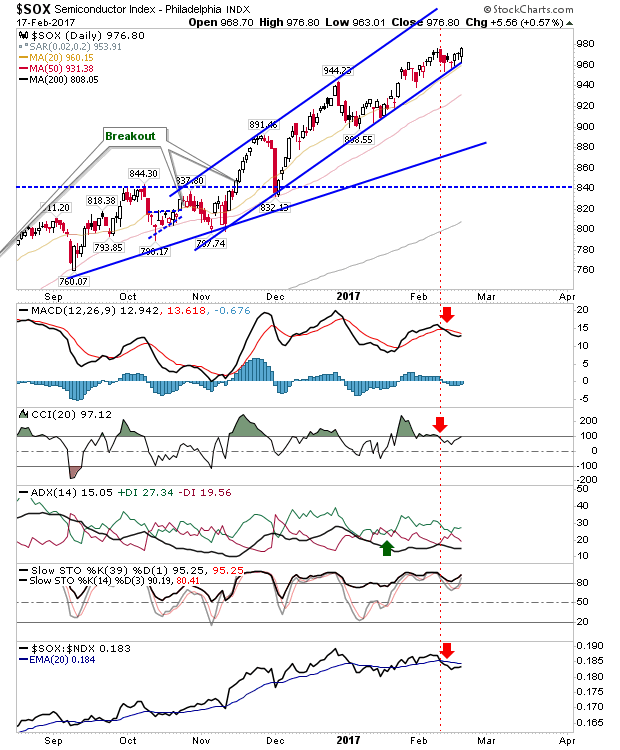
The Semiconductor Index is rising along channel support, but with technicals showing mixed form it's probably going to move to test the slower trendline sooner rather than later. But when it does, it's going to threaten the strong rallies in the NASDAQ and NASDAQ 100.
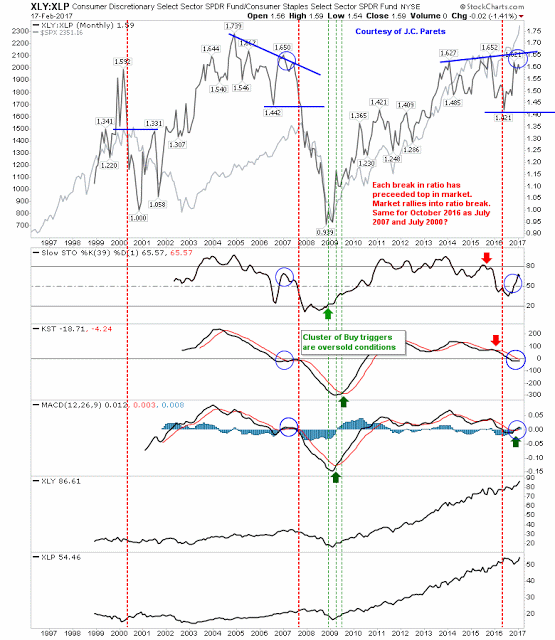
Other watch areas are the the long term relationship between Discretionary (via Consumer Discretionary Select Sector SPDR (NYSE:XLY)) and Staples (via Consumer Staples Select Sector SPDR (NYSE:XLP)) stocks. Bulls can take the most comfort from this as it doesn't look like the rally will end anytime soon; or at least until expanding wedge resistance is tested (blue circle). This relationship typically deteriorates before the market peaks. It had looked like it was doing so last February, but it managed to recover.
We've just finished a holiday weekend, so it will be today, Tuesday, before we see what happens (and what further mud Trump can stir up). I haven't updated the Bottom Watch table, which I'll do when the market finally puts in some form of top.
