Mixed Setups With Something For Both Bulls And Bears

Published 04/30/2018, 12:17 AM
Updated 07/09/2023, 06:31 AM
NDX
-
US500
-
DJI
-
US2000
-
IXIC
-
SOX
-

Markets started Friday strong - challenging resistance - but were unable to press this advantage. Many indices closed lower, leaving 'black candlesticks' which are typically bearish when formed at 'swing highs' but still favor weakness even in the absence of the swing high setup.

The 'black candlestick' for the NASDAQ at resistance suggests a move towards the 200-day MA but for this to happen there needs to be an immediate downside; any recovery has a strong chance of negating the 'black candlestick'.
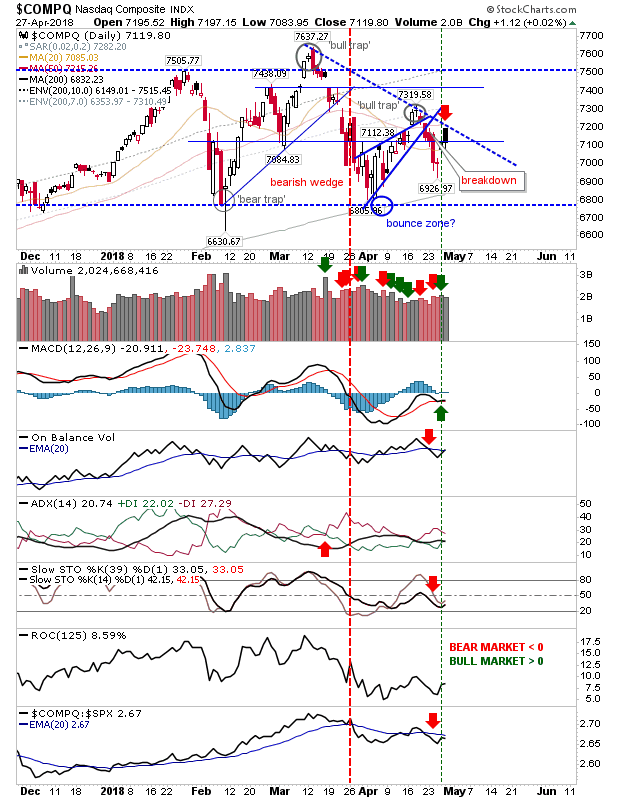
COMPQ Daily Chart


The S&P did not finish so weak. There was no 'black candlestick' but instead a low key doji may offer itself as upside
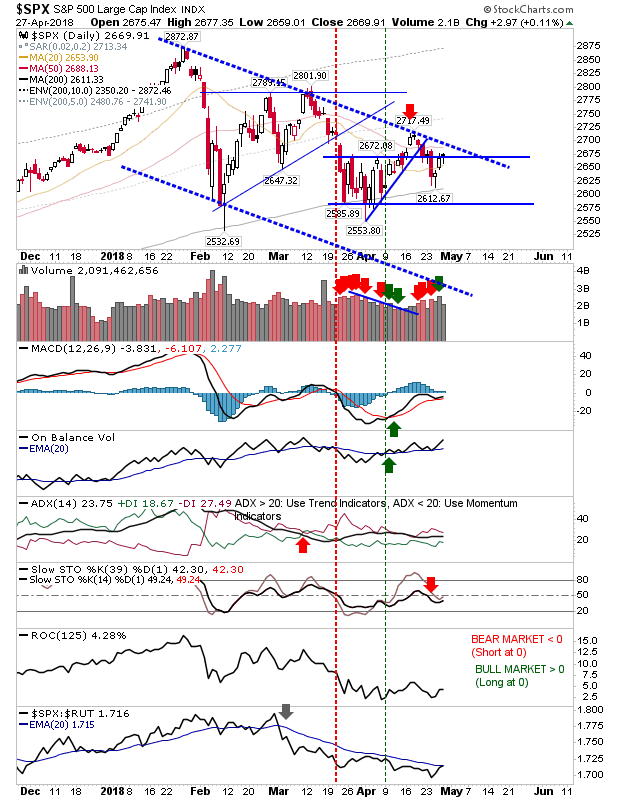
SPX Daily Chart


The Russell 2000 is hugging its respective 20-day and 50-day MAs without rocking the boat either way. It may be edging in favor of bulls because its holding these moving averages—a strong start on Monday would open up for a challenge of triangle resistance and potentially negate the bearish wedge 'bull trap'.
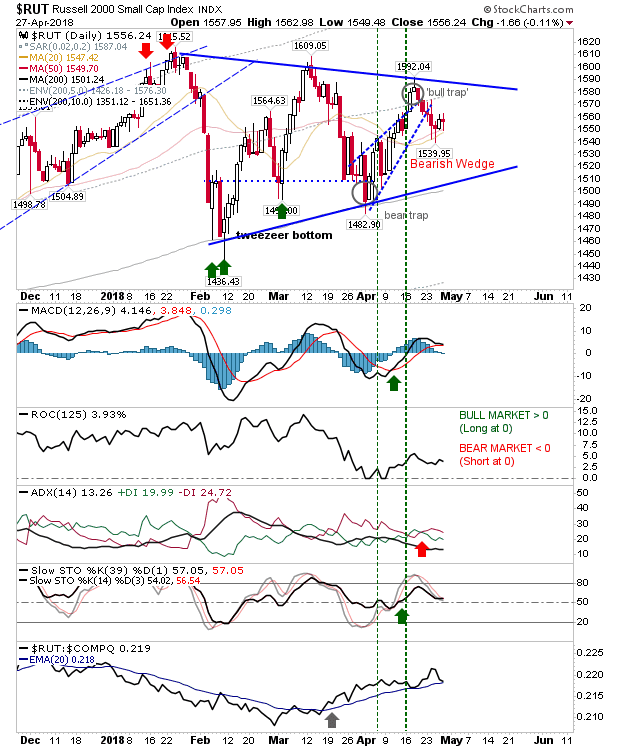
RUT Daily Chart


The Dow Jones Industrial Average is holding to its mini-tweezer low which set up the return above the downward channel; it's a decent long setup with the 200-day MA also available for support / risk measured off the tweezer bottom.
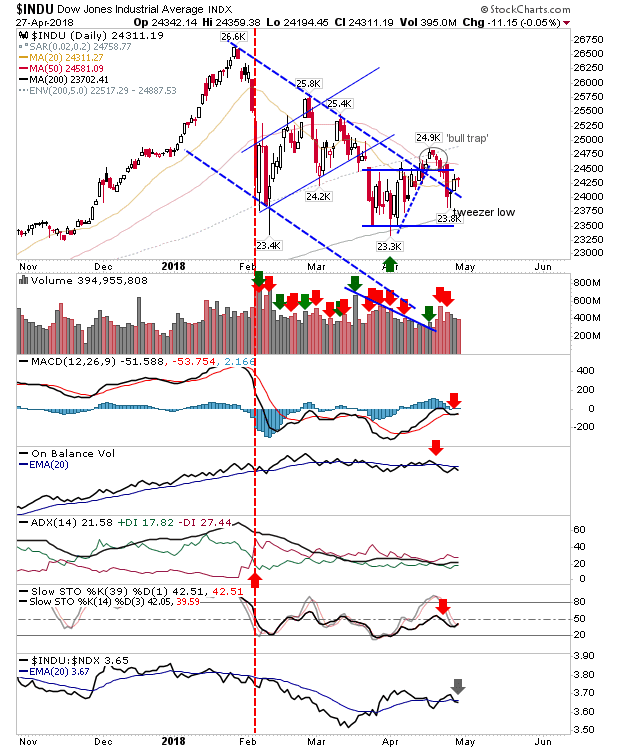
INDU Daily Chart


The NASDAQ 100 is on the bearish side of the fence. The 'black candlestick' tagged declining resistance with the 50-day MA as additional resistance.
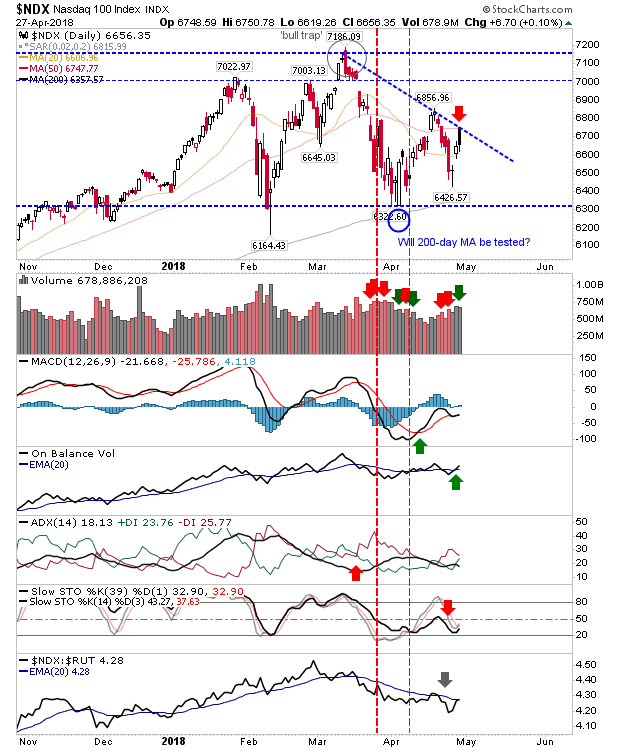
NDX Daily Chart


The weakest index is the Semiconductor Index. The index is not close to declining resistance (which other indices have tested or are close to testing), it's struggling in its bounce off its 200-day MA, plus it reversed off long-term support - now resistance. A loss of 1,220 could see a rapid acceleration in its losses, on top of what it has already lost off its highs.
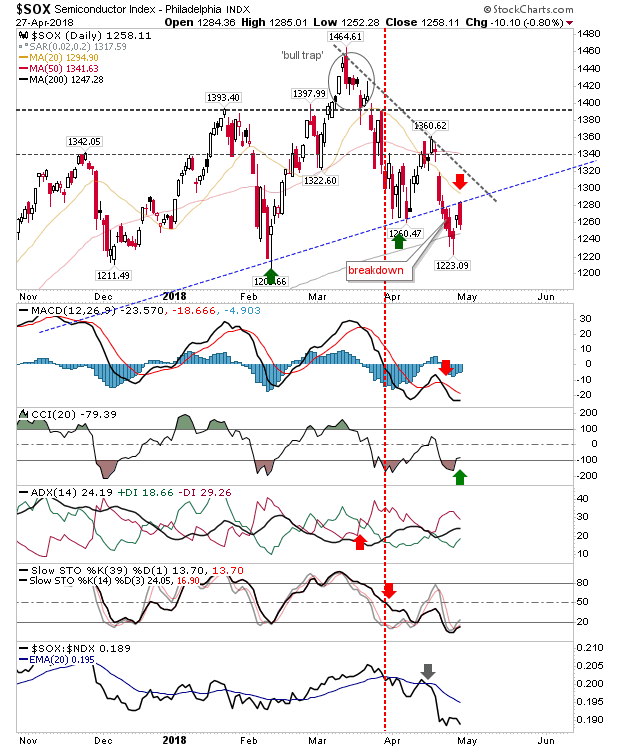
SOX Daily Chart


For today, shorts can focus on the NASDAQ, NASDAQ 100 and Semiconductor Index. Longs can look to the Dow Jones, S&P and potentially the Russell 2000; although the latter index can go either way.

Latest comments

Loading next article…
Risk Disclosure: Trading in financial instruments and/or cryptocurrencies involves high risks including the risk of losing some, or all, of your investment amount, and may not be suitable for all investors. Prices of cryptocurrencies are extremely volatile and may be affected by external factors such as financial, regulatory or political events. Trading on margin increases the financial risks.
Before deciding to trade in financial instrument or cryptocurrencies you should be fully informed of the risks and costs associated with trading the financial markets, carefully consider your investment objectives, level of experience, and risk appetite, and seek professional advice where needed.
Fusion Media would like to remind you that the data contained in this website is not necessarily real-time nor accurate. The data and prices on the website are not necessarily provided by any market or exchange, but may be provided by market makers, and so prices may not be accurate and may differ from the actual price at any given market, meaning prices are indicative and not appropriate for trading purposes. Fusion Media and any provider of the data contained in this website will not accept liability for any loss or damage as a result of your trading, or your reliance on the information contained within this website.
It is prohibited to use, store, reproduce, display, modify, transmit or distribute the data contained in this website without the explicit prior written permission of Fusion Media and/or the data provider. All intellectual property rights are reserved by the providers and/or the exchange providing the data contained in this website.
Fusion Media may be compensated by the advertisers that appear on the website, based on your interaction with the advertisements or advertisers.
© 2007-2025 - Fusion Media Limited. All Rights Reserved.