After an initial “Trump Dump” on a flee to safety post the Syrian missile attack, some normalcy returns to Friday’s market.
As mentioned this morning, after the initial safe-haven knee-jerk across currencies, bonds, metals and stocks, calmer heads have prevailed. The key question was always was this the start of an escalation of armed intervention by the United States into Syria? The answer after a few hours is starting to look increasingly like no, which I tend to concur with. This has seen a general pullback in the initial moves immediately post the cruise missile attack as the rhetoric from the White House appears to signal “one and done” for now.
The other elephants in the room, namely Russia and Iran, have made a few noises, but for now, it appears to be more hot air than sabre rattling. China has also been mostly silent as this was a none too subtle signal to them with regards to North Korea as well. The question of whether the United States is going to act in a more forthright manner, and start smashing walnuts with hammers on little to no notice, is a question for another day. What is clear is that Mr Trump is a bear that sleeps lightly and shouldn’t be poked with a stick too often.
Looking around the markets, we have seen a definite shift in sentiment as we run into European trading and it may well be that by New York time, the main event of the day will return to being the Non-Farm Payrolls.
FX
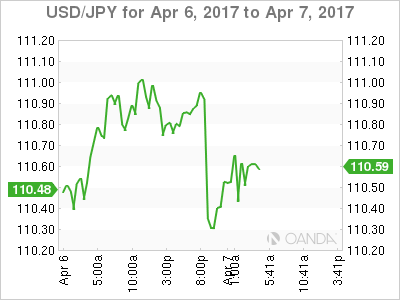
Dropped from 110.80 area to 110.15 initially but has since rallied back to 1110.60 to sit solidly in the middle of its recent trading range. The pivotal support area at 110.00/10 sits unchallenged and for now looks as though we will have to wait for tonight’s data to see if we have a serious test. We expect a lot of two-way interest around this level from the wholesale market.
Resistance lies at the 111.00 days highs followed by 111.50 and 112.25.
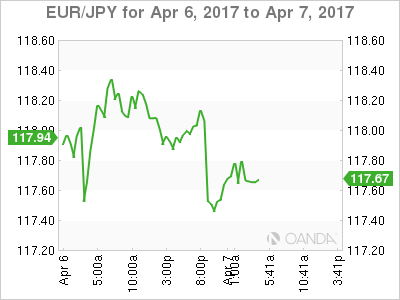
Fell from 117.90 to 117.35 before bouncing to 117.75 with USD/JPY, pivoting around its 200-day moving average at 117.70. Trading in the cross has been relatively directionless for the last few hours, but in the bigger technical picture remain in a downward channel.
Resistance lies at 118.15, the days high and descending resistance line. Above here next resistance is at 118.95.
Support lies at 118.15/20 initially, being the days low and the lows of the last three sessions. A daily close here implies a move to the 116.25 support region.
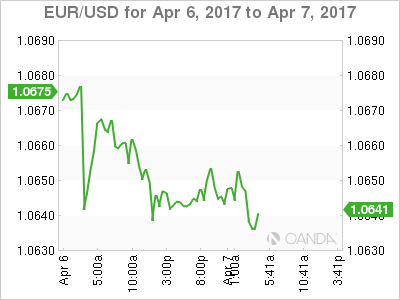
Has shrugged off the attack this morning to remain in “cruise control.” Supported by haven flows into Bunds which is off-setting the EUR/JPY selling, euro is clearly waiting for the Non-Farm Payrolls and not the next missile attack.
Support sits at the 200-day moving average (DMA) at 1.0628, followed by 1.0600 and then the much bigger 1.0500 level.
Resistance awaits at 1.0685 and 1.0700 with a daily close above implying a potentially decent rally back above 1.0800 is on the cards.
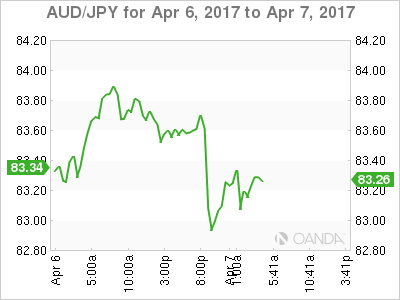
This still looks constructively bearish on the longer term charts but has recouped some of its risk-off selling this afternoon as well.
Trading mid-range at 83.22, AUD/JPY has resistance at 83.70 and support at 82.80. The 200 DMA at 81.90 is the key technical area in the short-term.
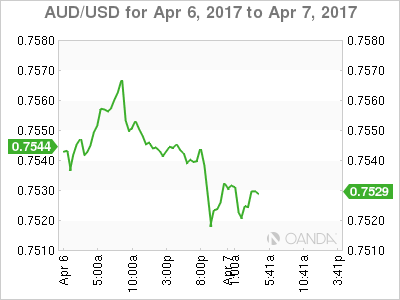
AUD has continued its downtrend today and looks as though it would have done so regardless of events in Syria. Dahlian coal futures falling 7 % today won’t have helped either.
Trading at 7525, AUD sits just above its 100 DMA at 7517 and then key support at 7490. Resistance appears at 7550 and then 7626, the 200 DMA.
PRECIOUS METALS
Gold
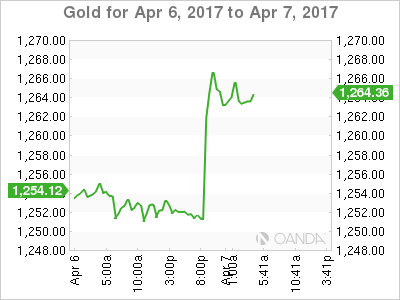
Gold raced from 1250 to 1270 before settling at 1263.50. In the process breaking its 200 DMA at 1258.50, and previous highs at 1261.50 and 1264. Gold remains elevated on the charts, and one would expect it to remain so after this morning’s events.
A daily close above these levels would be bullish from a technical point of view. Pointing to move towards the 1300 level.
Resistance is at the day’s high at 1270 with big picture support at 1250 and 1240.
Silver
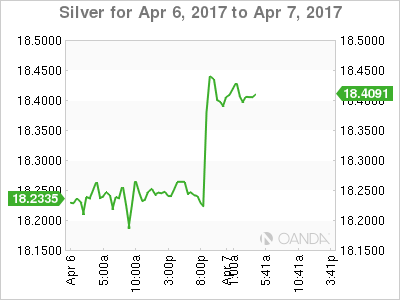
Silver raced from 18.2100 to 18.4800 this morning but failed here. This is the previous high from the 27th February. A failure to close above here tonight would put a decent double top in place at this level. A close above this resistance would imply a move to the 19.0000 level from November last year.
Support sits at 18.2100, the day’s lows, and then at 18.0600, the 200 DMA which has held all pullbacks in the last week very nicely. A close below 18.0000 would imply a larger correction is on the cards but like gold, it remains elevated on risk aversion flows for now.
STOCK INDICES AND BONDS
ASX
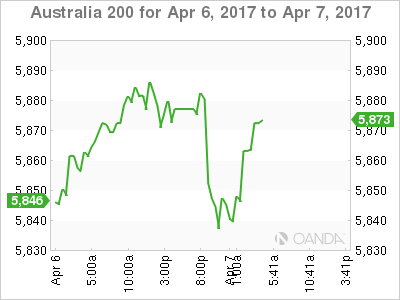
Sold off from 5890 to 5837 before recovering to 5863. From a technical perspective, the ASX is in a bullish consolidation pennant formation still. The base being 5820 and the top being 5910. A daily close above or below is required to confirm the next major directional move.
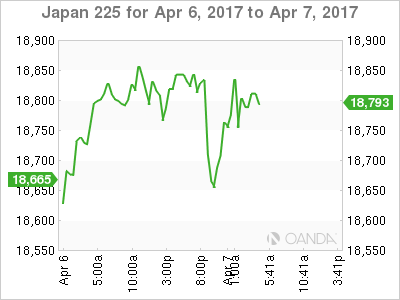
Initially sold off along with the South Korea KOSPI, as the implications of a more aggressive U.S. policy vis-a-vis North Korea sunk in. However, the Nikkei has recovered nearly all its losses, buoyed by a 7% move in Toshiba as bids came in for its chip business.
In the bigger technical picture though, the Nikkei still sits near four-month lows as a stronger Yen weighs on exporter stocks.
Resistance sits nearby at 18,870 and then 19,125, the 100 DMA and some previous daily highs. Support appears at 18,595 and then 18,220.
S&P
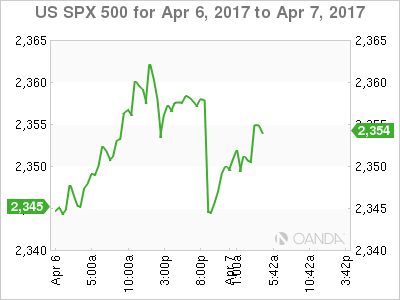
As a higher beta to the actions of the U.S. Government, the S&P has not rallied back as far as some of the other regional indices.
Trading at 2350 as I write, support appears nearby at 2330 followed by 2320. The 100 DMA sits at 2297, and it would need a daily close below there before people start trying to pick the top in the U.S. stock market.
Resistance lies at 2380 and then 2400.
US 5 Year’s
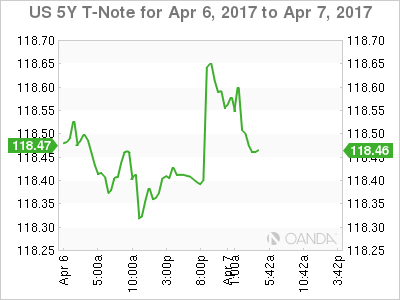
Prices rallied across the U.S. curve as a flight to quality ensued as the missiles went cruising across Syria. Most interestingly the 5-year has given back half of its gains already today, and if you compare the chart below to the 2-year and 10-year, the shape and pullback are almost identical. Clearly, the Non-Farms will be the bigger event today for the rates market.
Summary
Friday got off to an emotional start with the United State’s cruise missile attack on Syria. Risk assets sold off across all asset classes as fast money raced to safe havens. However, with the exception of precious metals, most asset classes have made back quite a lot of their initial moves. This implies that current thinking is that this was a one of and not a more interventionist policy by America. Today’s attention appears to be quickly turning to tonight’s Non-Farm Payroll’s, which will set the market direction into next week.
