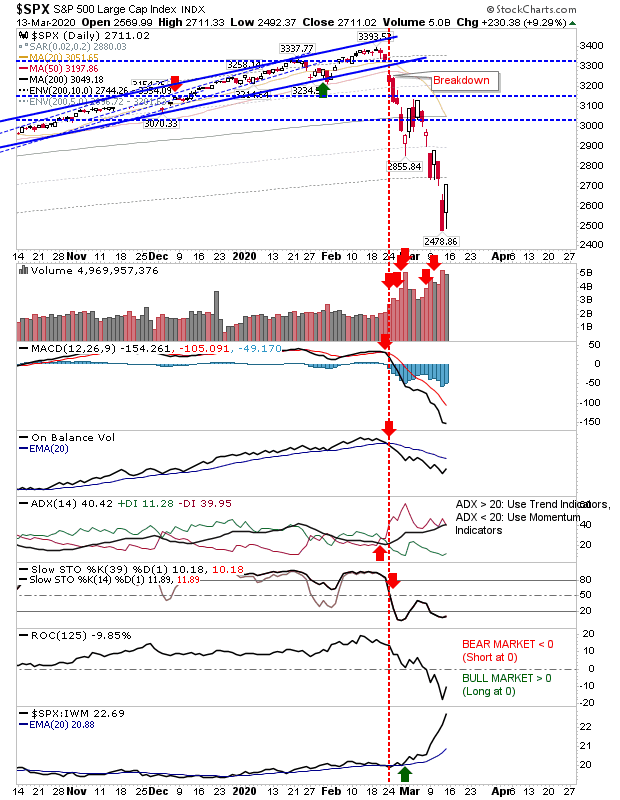
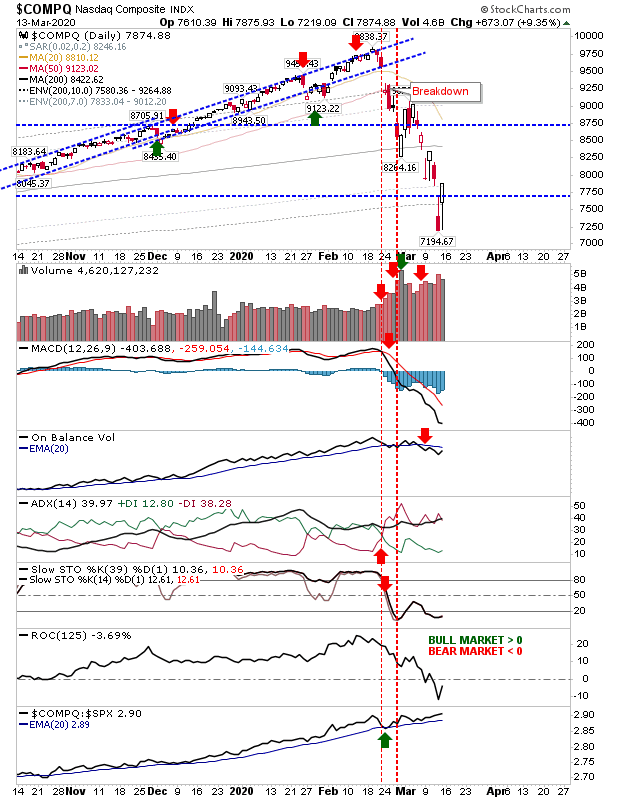
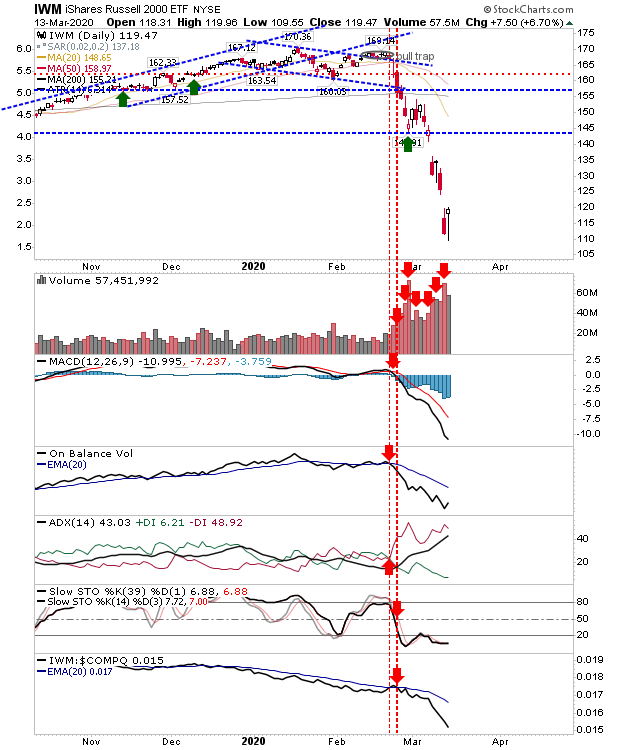
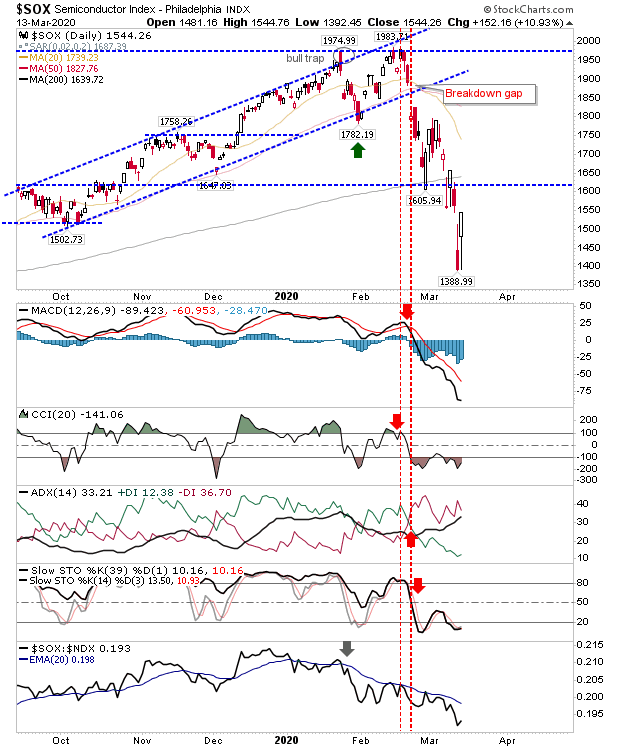
It has been so long since we have made trading days like the ones we've had the past couple of weeks. Friday was no exception as markets posted 6-9% day gains following comparable losses the day before. One only has to look at the price congestion from earlier in the year and the latter part of 2019 to see how weeks' worth of action is now playing out in the course of one day.
Nobody knows to what extent Covid-19 will hit this year's earnings, or what the long-term effects on consumer demand, supply chain security and the gig economy will be, but as an acute infection with a relatively low mortality rate (thankfully, this is not Ebola), the recovery should work through quick enough. Aside from the morbidity factors of the disease, the impacts on loss of earnings for gig economy workers will be significant and it will be interesting to see what (if any?) changes are made in the employment conditions for such workers and other vulnerable employees in scenarios like these. And much of this will probably be determined by whether Trump is re-elected or (supposed) Biden wins the presidency.
Going back to the charts, we had the biggest gains in Large Caps and Tech indices on Friday. The sizable rally in the S&P 50 keeps it in the 5% zone of historically weak action, but I suspect we are going to see some form of retest during the summer in the 2,450-2,700 range once daily trading ranges and volatility return to some form of normalcy. For now, it's a question of finding where the first leg down establishes its low—then seeing how it retests over the coming months.
Again, given the oversell we have seen, I think Thursday's low will probably mark the initial low to be defended for the rest of 2020.

The NASDAQ was another index to make a 9%+ gain. It has returned to the 15% zone of historic weak action (still an accumulate, but no longer a strong buy) as it retains its relative performance advantage against the S&P. It ROC only recently crossed below the 0% line—marking a bear market—but if it can quickly recover from this (i.e. return above 0%) it might turn into something with a little more bullish wind to its sails.

By virtue of the rout in Small Caps, buyers were less reluctant to partake in the recovery with the index 'only' finishing 6.7% higher from Thursday. It even managed to make a lower low over the course of the day, but this low should be the one to define it as the 52-week low to defend for 2020. The index is well beyond the 1.0% of historic weak action for the index and remains in 'strong buy' territory.

Semiconductors were able to run up double-digit gains, but haven't suffered the same degree of loss as the NASDAQ, S&P or Russell 2000; in fact, the index remains in relatively rude health, although it had shifted to a period of underperformance against the NASDAQ 100 in January—it may be able to gather steam if it can regain its 200-day MA and swing relative performance back in its favor.

Going forward, we are probably close to a trader's bounce buy; hourly charts may present a better risk:reward opportunity but markets at the very least need to consolidate the losses and figure out where next.
It could be a slow grind lower—as in 2000/01—or a quick bounce higher as happened in 2018, or a stealth rally, as in 2009. Investors need only have made their initial monthly or weekly purchase and should be ignoring the day-to-day noise which is only going to get louder as the weeks go by and the disease develops in the U.S. I have added a few more charts on breadth metrics here.
