-
China Approves National Security legislation for Hong Kong – Hang Seng drops 1%.
-
S&P 500 above 200-day moving average – signals possible change in long term trend.
-
US coronavirus death toll hits 100,000.
Markets
Shares in Asia were mixed on Thursday. Japan’s Nikkei shot higher but the Hang Seng led the declines after China’s parliament approved the new Hong Kong security legislation. It was a different story on Wall Street, which rocketed higher as the S&P 500 moved above the 3000 price level and its 200-day moving average. European markets are tracking the optimism on Wall Street with a higher open on Thursday. Cineworld was a top riser while Rolls Royce (LON:RR) was a top faller.
TheUS dollar was slightly firmer; bringing EUR/USD back toward 1.10 and GBP/USD under 1.23. Gold ended well off its lows beneath $1700 per oz yesterday and is continuing the rise this morning. Oil is pulling back after the surprise inventory build in the US reported yesterday.
HK Law Passes
What is happening with Hong Kong feels like the first frost in a new Cold War. Most observers agree the security law just passed in China will be bad for freedom and independence in Hong Kong. US Secretary of State Pompeo described Hong Kong as "no longer independent from China". Rather separately is whether it will be bad for Hong Kong shares and broader markets.
It looks like China has made the strategic decision that it no longer needs Hong Kong as its gateway to the world. Rather it will open up the mainland to levels it is comfortable with. The bill is bad for Hong Kong either way you cut it; short term there are more protests and longer term less capital flowing in from overseas. Quite how quickly that capital dries up may rest with the announcement President Trump will make this week on the US ‘response’.
Peak reopening optimism?
We worry about reaching ‘peak reopening optimism’. Hard evidence about the recovery will come after June when most lockdown restrictions have been lifted. The market has a tendency to move ahead of the evidence.
As it stands, the US-China spat over Hong Kong and the origins of the coronavirus feel more political than economic. Phase two of the trade deal was a ways off anyway and phase one is still on track. Even new US sanctions against China as punishment for its incarceration of Muslim Uighurs can be considered separate from the trade deal, and keep a return to the trade war out of reach.
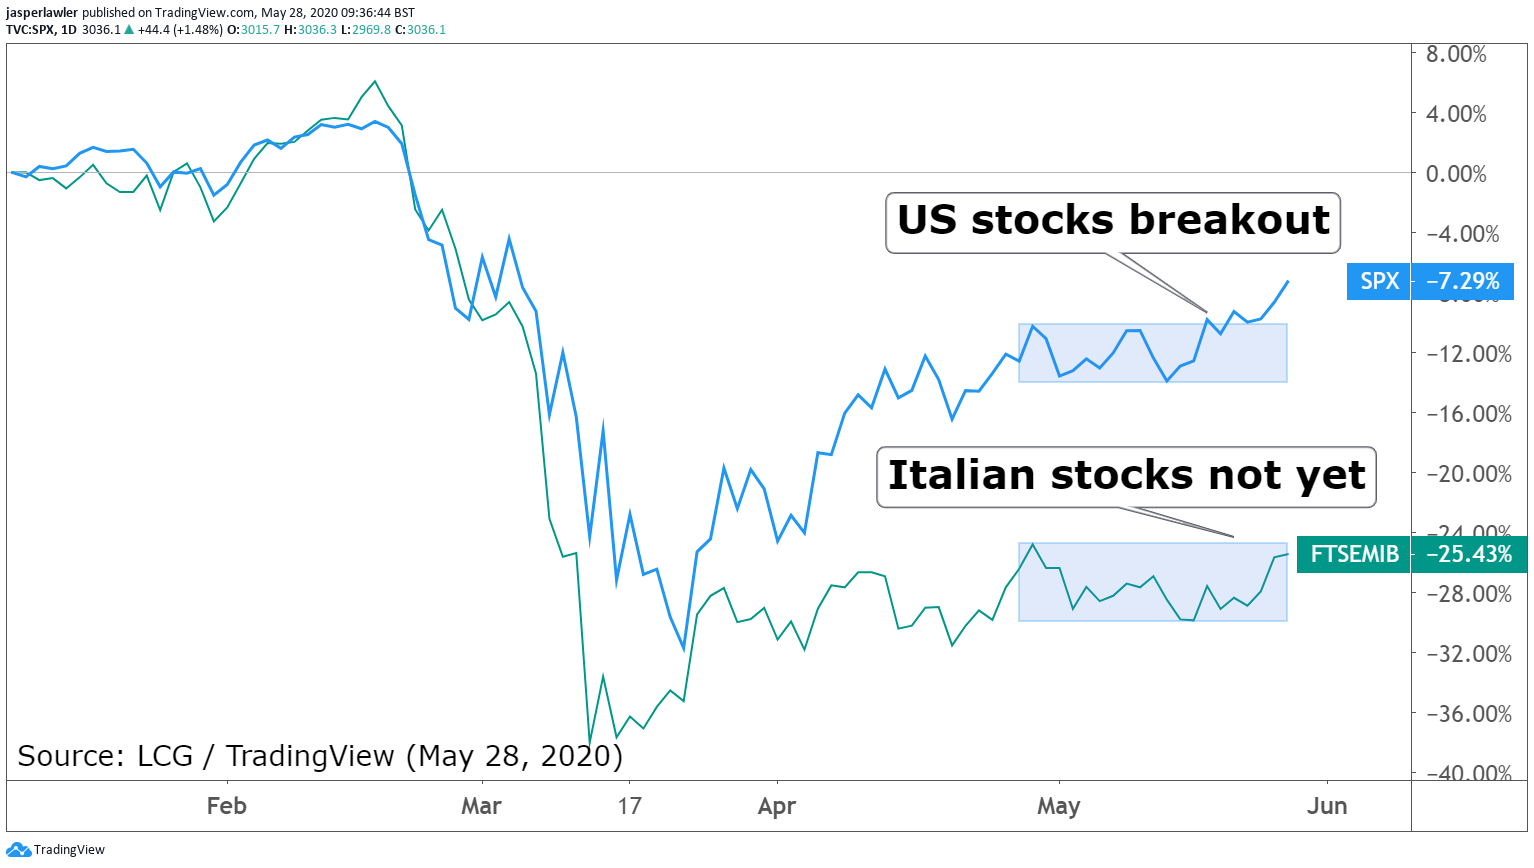
Chart: S&P 500 vs FTSE MIB (year-to-date)

The breakout above a month-long trading range in the S&P 500 500 has yet been confirmed by weaker global indices like Italy’s FTSE MIB. One would expect the FTSE MIB to catchup if reopening optimism is really taking hold since Italy was one of the worst-hit during the pandemic and a big possible beneficiary of the EU Recovery Fund.
