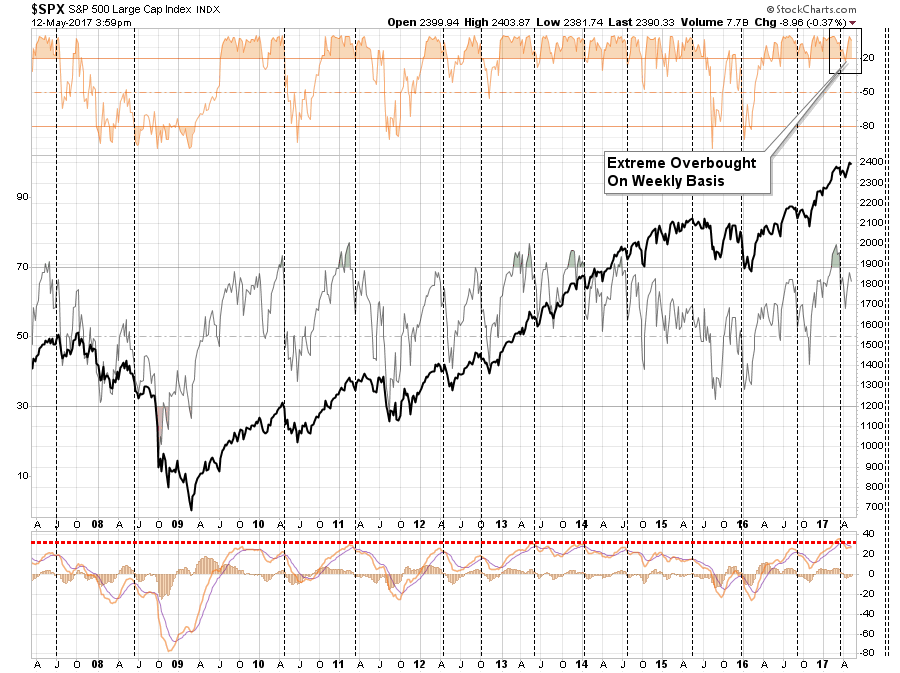
In this past weekend’s newsletter, I discussed the fact this market has been “nothing short of boring” as of late, but remains on a “bullish buy signal” currently. To wit:
Importantly, the ‘buy’ signal that was registered in late April is very close to tripping a short-term sell signal. These signals have usually been indicative of short-term correction actions which can provide for better entry points for trading positions and rebalancing.
However, as shown below, on a longer-term basis the backdrop is more indicative of a potential correction rather than a further advance. With an intermediate-term (weekly) ‘sell’ signal triggered at historically high levels, the downside risk currently outweighs the potential for reward.
Of course, as has become a usual outcome, on Monday, the markets clung to an announcement that both Saudi Arabia and Russia had hinted at extended production cuts for a while longer. The announcement created a rush to close out oil shorts and lifted prices back above resistance at $48/bbl. The fundamental problem remains in a world in which global demand is weakening and supplies are still rising as shale production continues to expand. Not surprisingly, this will end badly in the not-so-distant future as the realization of the supply glut comes to fruition against the backdrop of weaker economic demand.
The push higher in energy prices did energize the markets enough to push back up to the top of the current trading range and temporarily stave off an approaching “sell signal.”
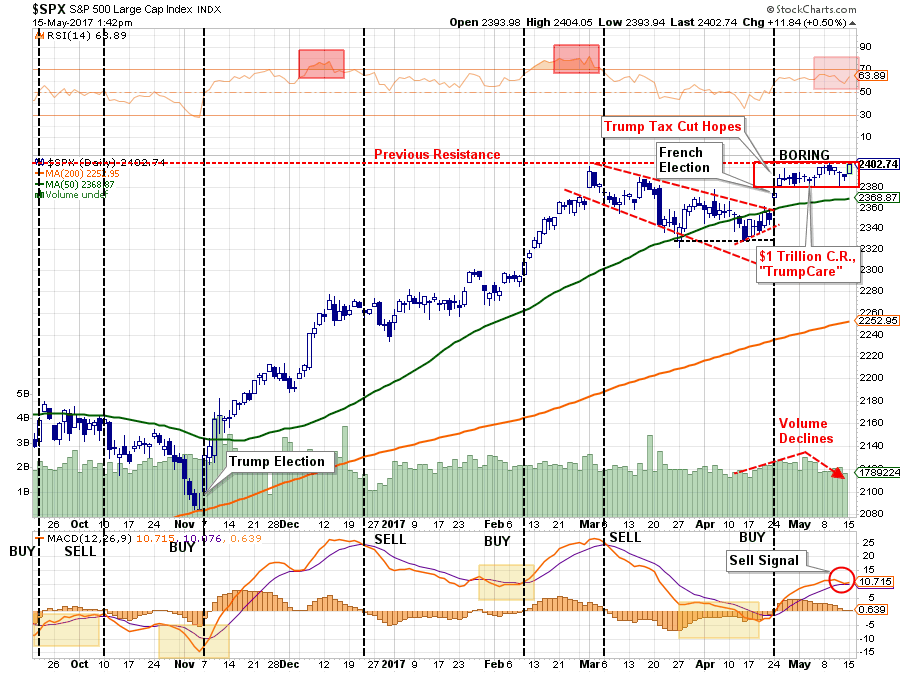
It is critically important the market rallies this week, enough to push the markets out of the current trading range and move asset prices higher on a broader base of participation.
Portfolios should remain weighted to the long-side currently, but some caution should be exercised as we move into the historically more volatile summer months which tends to sport weaker performance.
One Confused Market
As I stated above, the internal measures of the market have weakened substantially in recent months. As I showed previously, the problem is while the stock market has pushed higher, both the number of stocks on bullish buy signals and the number trading above their respective 200-day moving averages have continued to weaken.
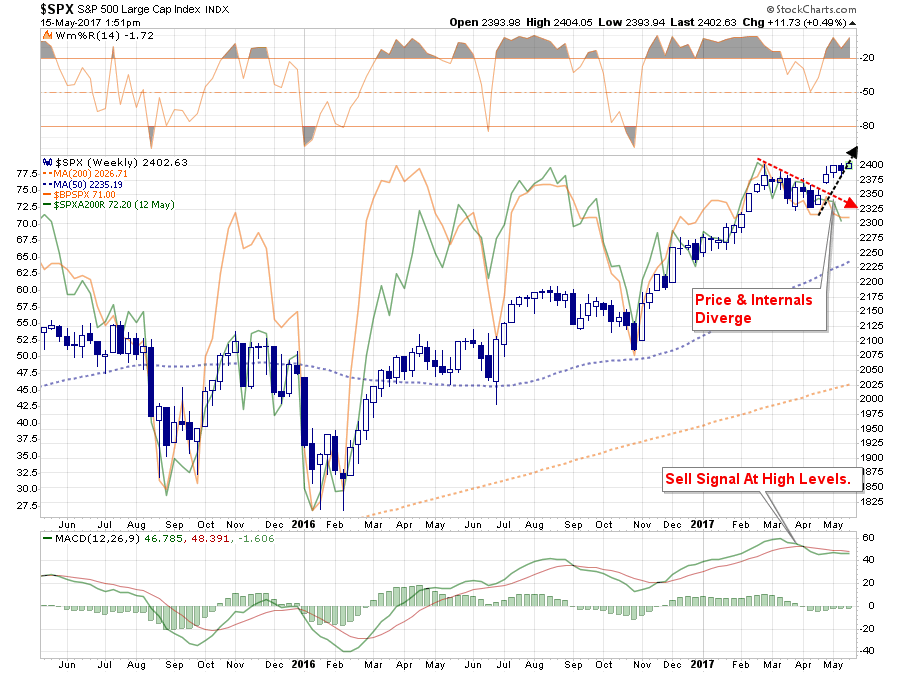
This divergence will likely not last much longer, the only question is whether the internals will “catch up,” as the “bulls” currently hope.
Interestingly, the overall market seems more “confused” as ever as to its general investment thesis. Let me walk you back in history for a moment prior to the election last year. As shown in the chart below, the market was fairly concentrated moving into the election as fears of a “Trump Victory” would elicit a major market route.
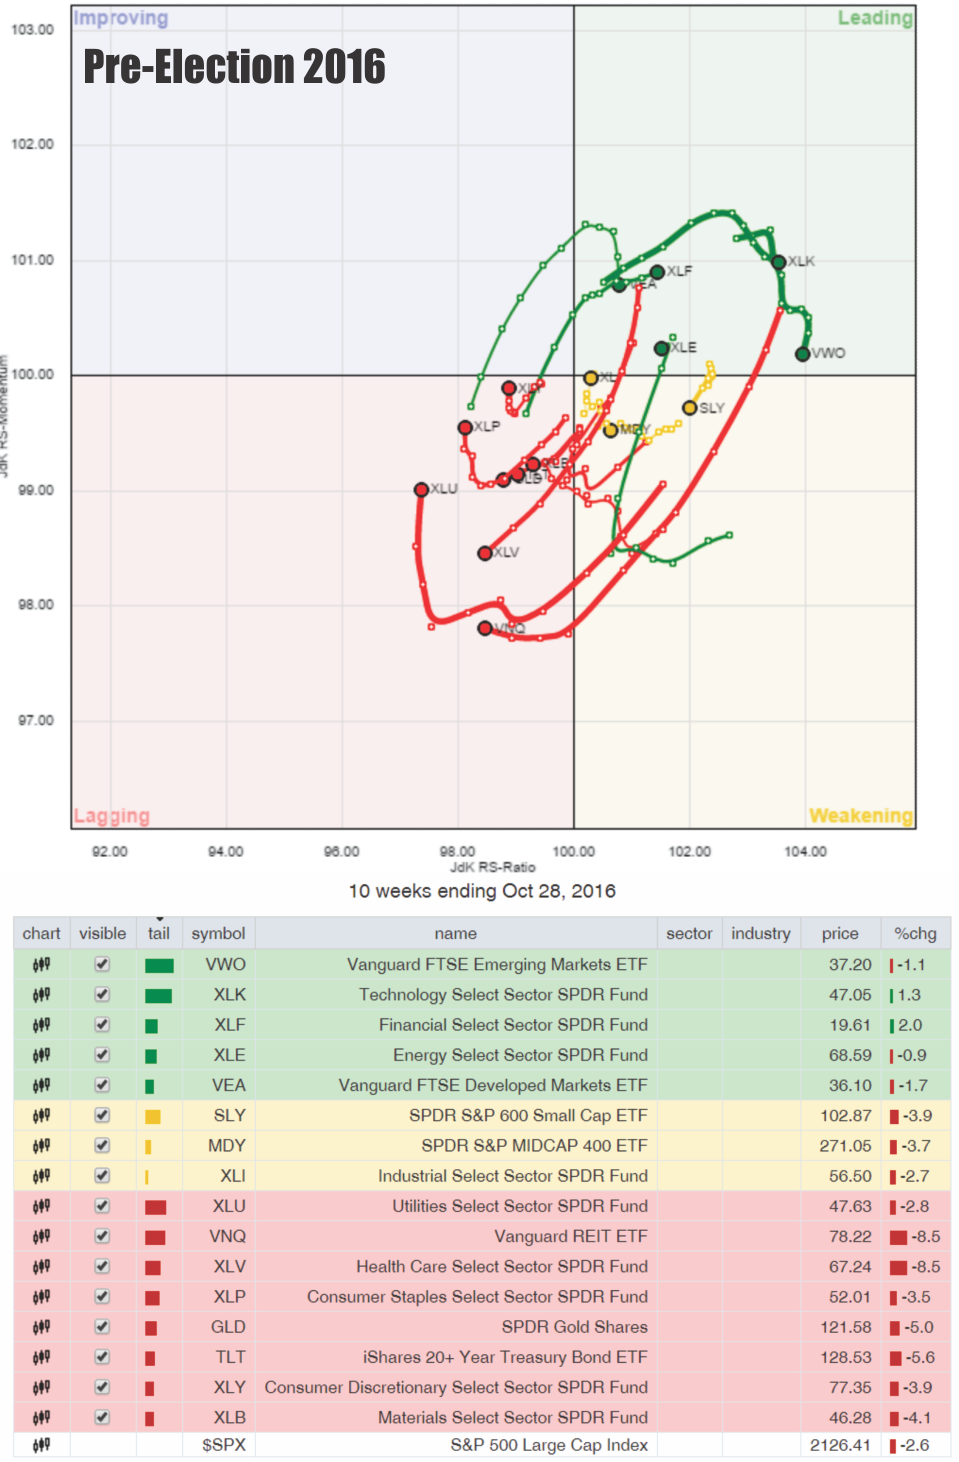
Following the election, the attitude changed quickly as the “Trumpflation” trade set in pushing Financials, Industrials and Materials to extremes at the end of the year. It was at this point that we began recommending adding to the deeply out-of-favor sectors for a “risk off” rotation trade moving into the New Year.
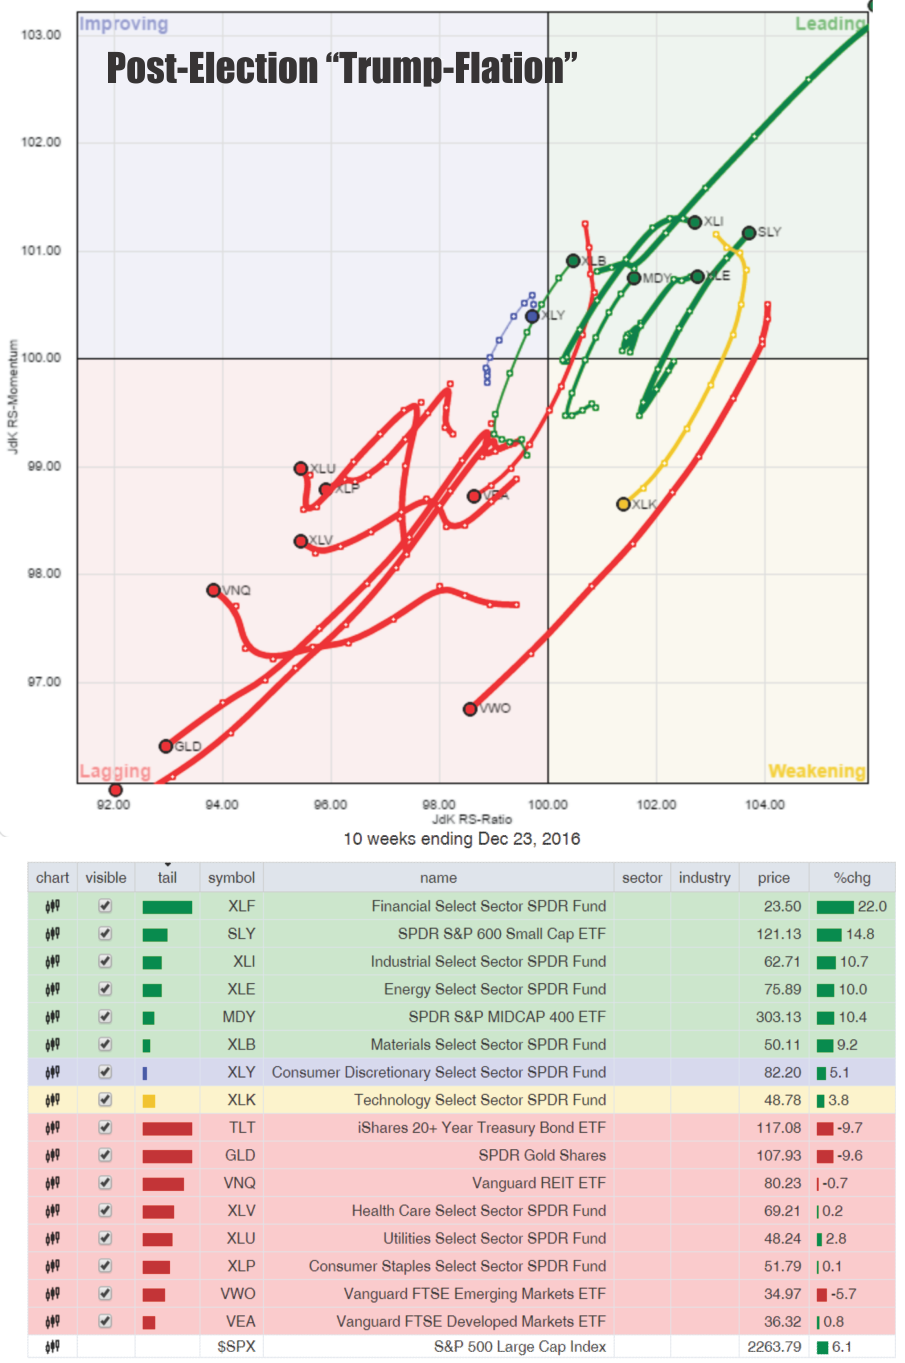
Of course, that was exactly what happened as the current Administration became quickly acquainted with Washington bureaucracy and political infighting. As hopes of a quick resolution to the health care debacle and tax reforms began to fade, the “Trumpflation” trade faded with it.
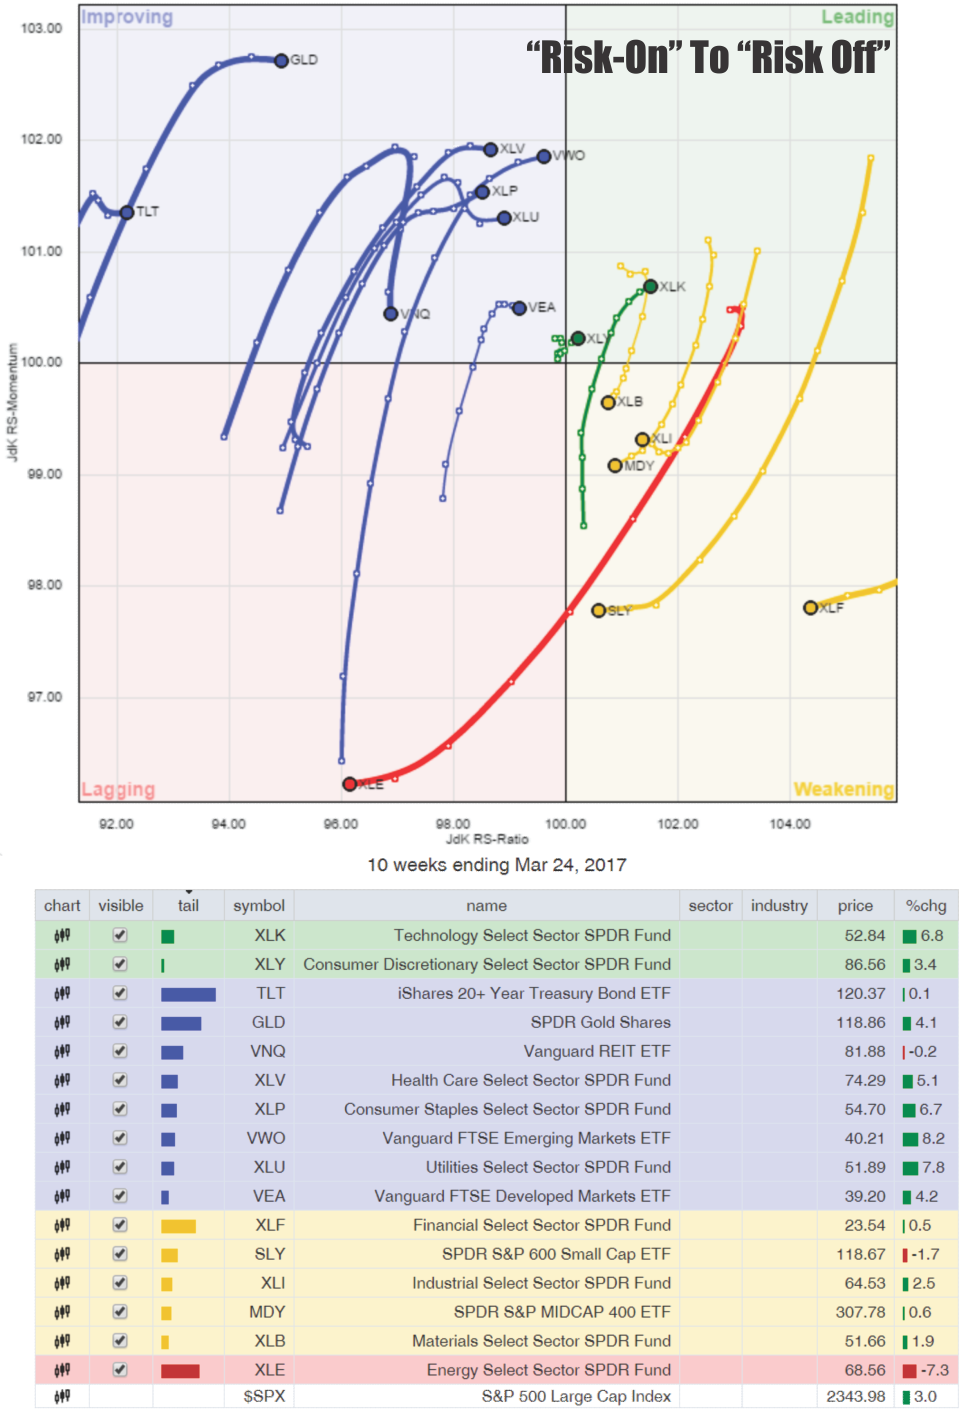
Now, a new problem has emerged, “confusion.” With time wearing on, the hopes of a swift reform of the tax code, which would be the primary boost to the resurgence in profitability, has faded. Furthermore, the early surge in consumer confidence has yet to transform into stronger economic activity. As noted over the weekend Morgan Stanley’s Chief Economist Ellen Zentner wrote:
ARIA appears to have fallen off a cliff in April, with a 0.72% decline, the largest since December 2008.
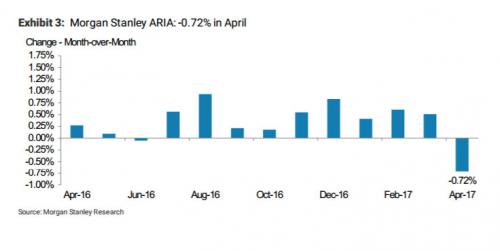
Note: ARIA, is a monthly US macro indicator based on data collected through primary research on key US sectors such as consumer, autos, housing, employment and business investment.
This has shown up in a bit of a “cluster ****” as money is quickly jumping from once sector to the next trying to figure out what the next “trade” is going to be.
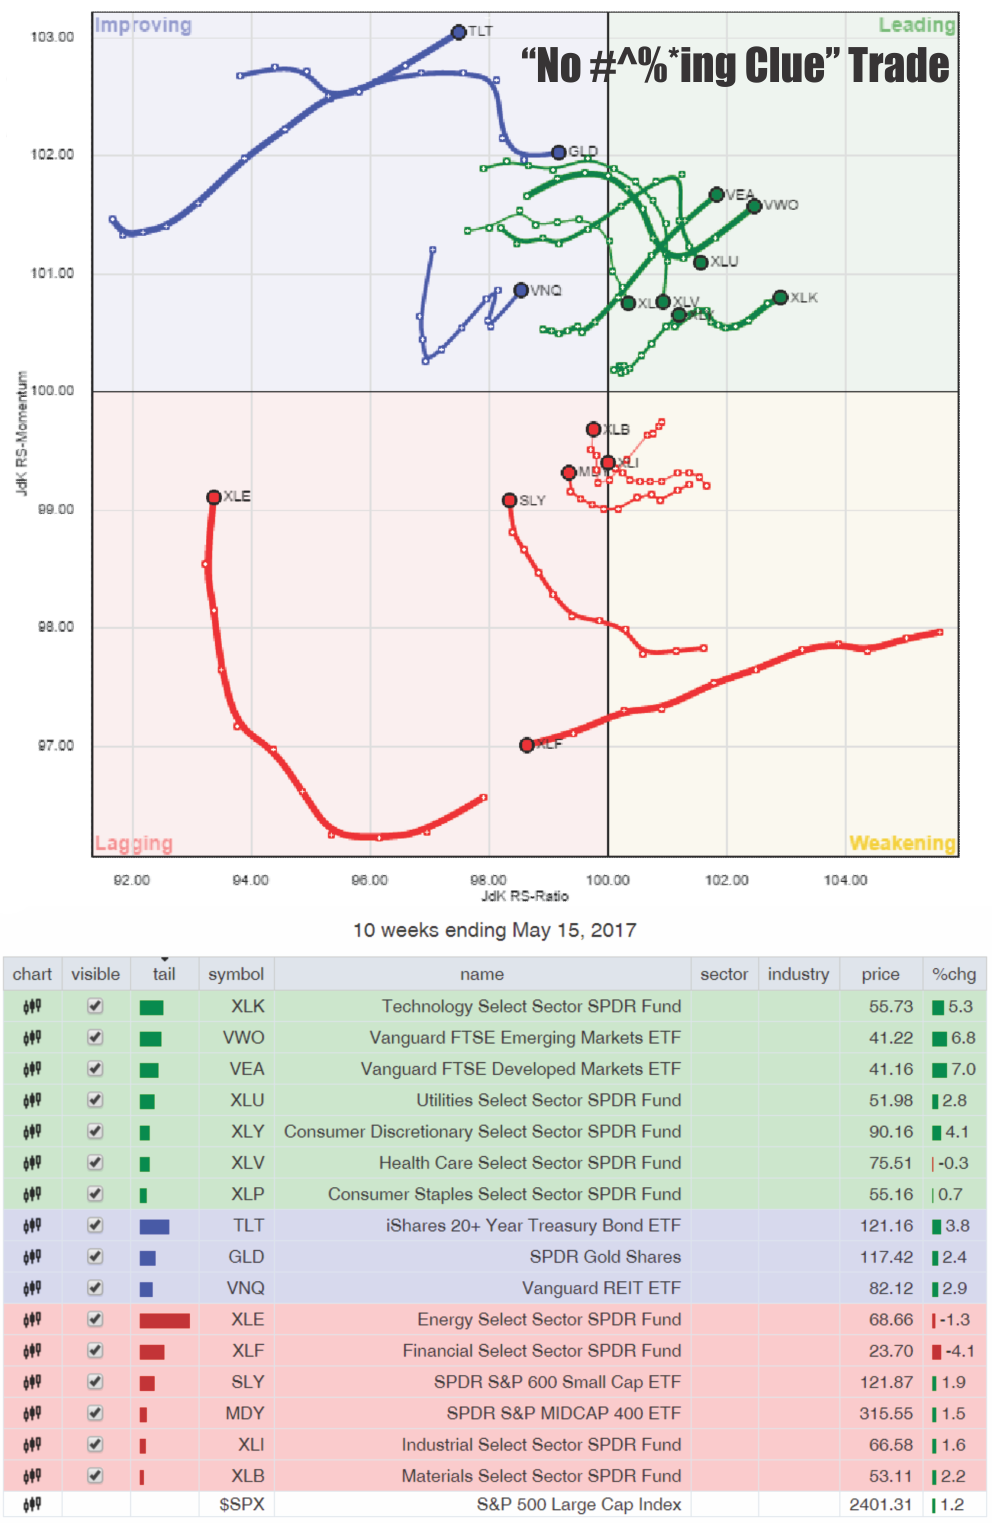
In the lead right now are sectors that are both “risk on” (ie Technology, Emerging Market and Discretionary) as well as the “risk off” sectors. (Utilities, Health Care and Staples).
Talk about confused.
The problem, of course, that both trades are unlikely to be right. Either the market is going to breakout to the upside with a clear participation in the “risk on” stocks, or money will begin a rotation into the “risk off” trade of bonds and defensive equities.
Net Positioning Suggests Caution
I currently suspect, although the market has defied logic in recent weeks, the outcome will lean toward the latter as we move further into the summer months. I base that assumption on the net positioning of traders in the recent Commitment of Traders reports.
Currently, the net-short positioning on the Volatility Index suggests there is a substantial amount of “fuel” to sustain a market “sell off” if one gets started for any reason.
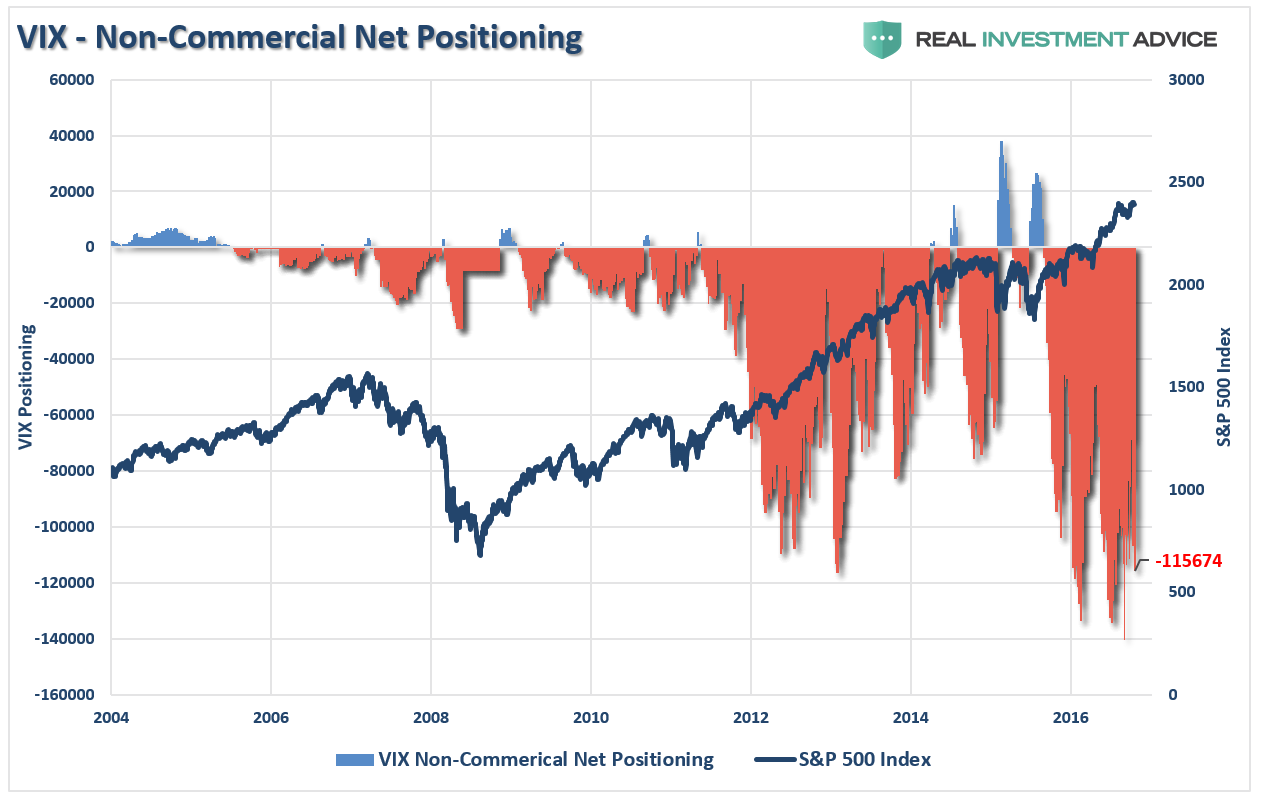
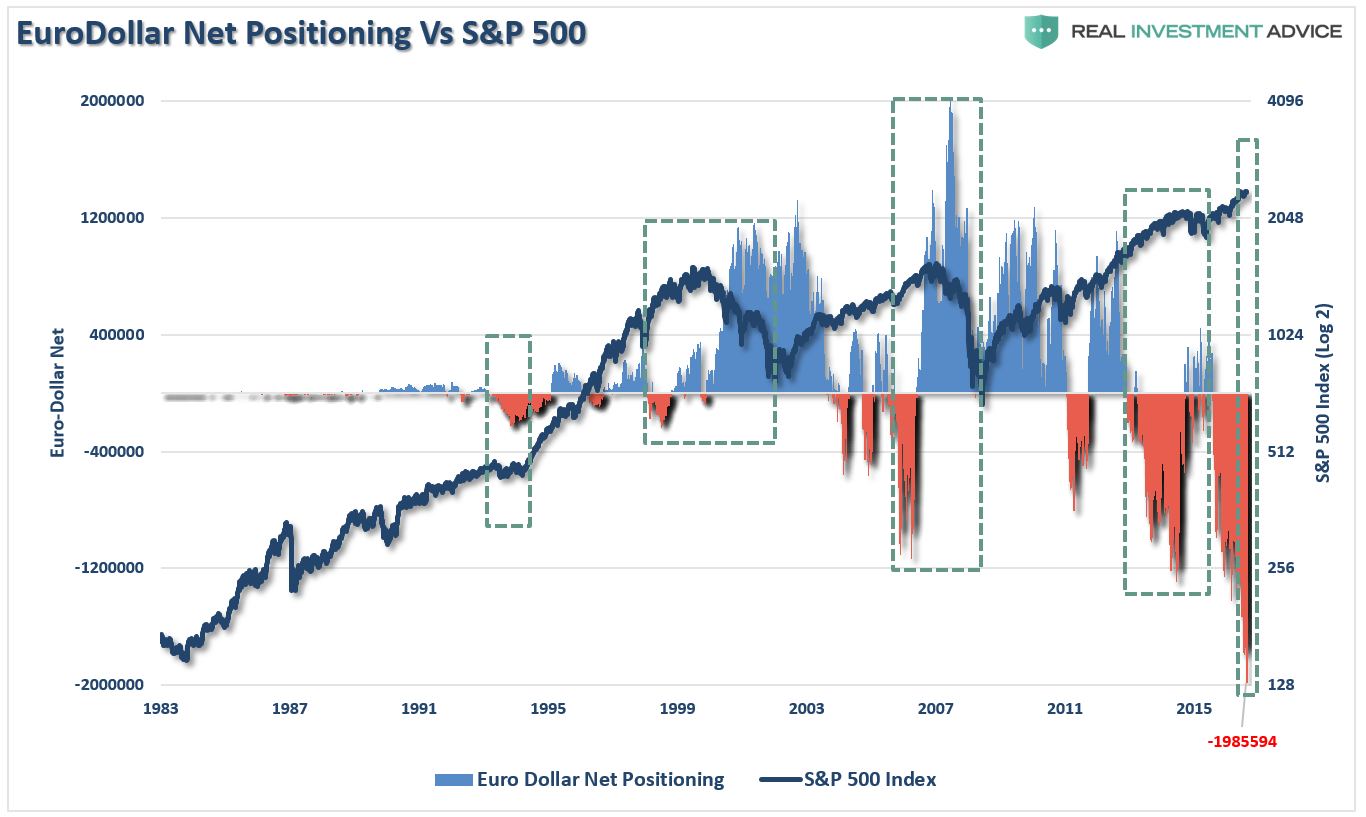
The net-short positioning in the euro-dollar also suggests much the same. The reversals of such large net-short positions have been associated with a liquidation run in the markets. With a record net-short position currently, combined with the VIX, the amount of “fuel” for an unwinding/reversion event could be much larger than most currently anticipate.
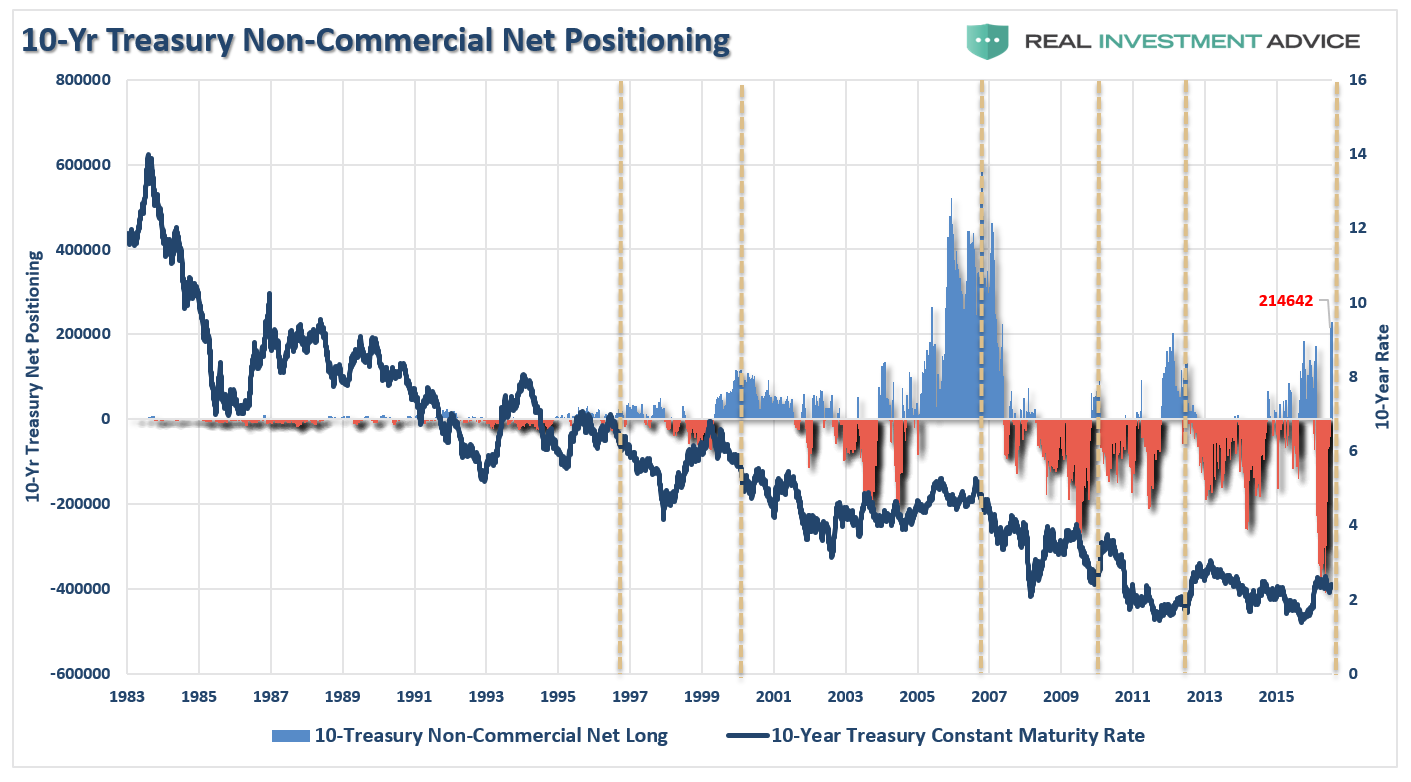
Of course, such an event would lead ultimately to inflows into the “risk off” trade which would primarily be U.S. Treasuries. The current net long positioning suggests “smart money” has already taken that bet and will use the rush of “panicked buyers” to “sell into” as gains are made. This would be the same as has been witnessed previously as rates have tended to fall (pushing bond prices higher) as the net positioning is reversed. (vertical dashed lines)
Let me repeat from this past weekend’s missive, the current advance has been driven by several artificial factors:
- Central Bank policies are succeeding in encouraging risk takers to take more risks in long-duration financial assets.
- Many U.S. corporations that face lackluster top-line growth are repurchasing stock in record amounts at record prices rather than doing capital spending to bolster their physical plant.
- Volatility-trending strategies, risk-parity trading systems, and other quant-programs, keep pushing stock prices to new all-time highs.
All this feeds on itself, but what’s surprising is that few question how the above factors contribute to higher asset prices. They fail to recognize that if there were no adverse consequences to low or negative interest rates, massive liquidity injections, and central banks buying stocks, these would have become permanent and continuous monetary-policy strategies decades ago.
However, in the short-term, we must recognize the potential for the markets to remain “irrational” longer than logic would currently dictate. This is why I am cautiously managing portfolio risk and allowing the markets to “tell me” what to do rather than guessing at it.
What happens over the next few days to weeks is really anyone’s guess. But, over the longer-term time horizon, I am unashamedly bearish as the current detachment between prices and fundamental reality can not last forever.
Eventually, something’s gotta give, but until then we must remember:
A bull market lasts until it is over. – Jim Dines
