With all major stock indices sitting at major support levels on their weekly charts, are you positioned to take advantage of any impending breakout to the downside?
Bring up your weekly charts and add the following levels to your watch-list.
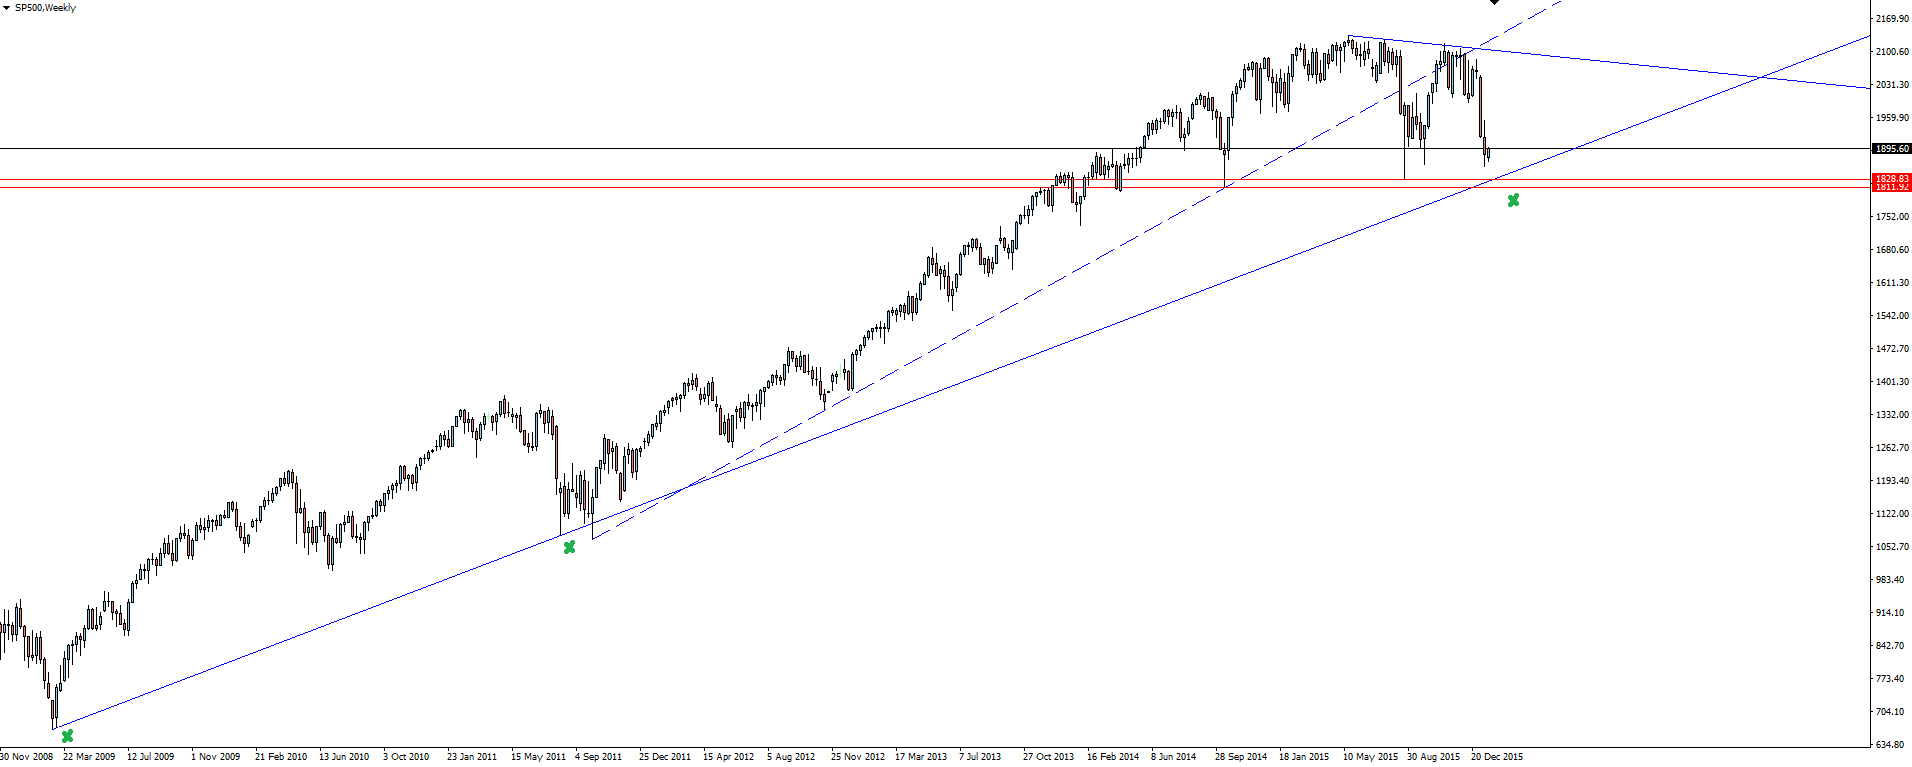
S&P 500 Weekly:
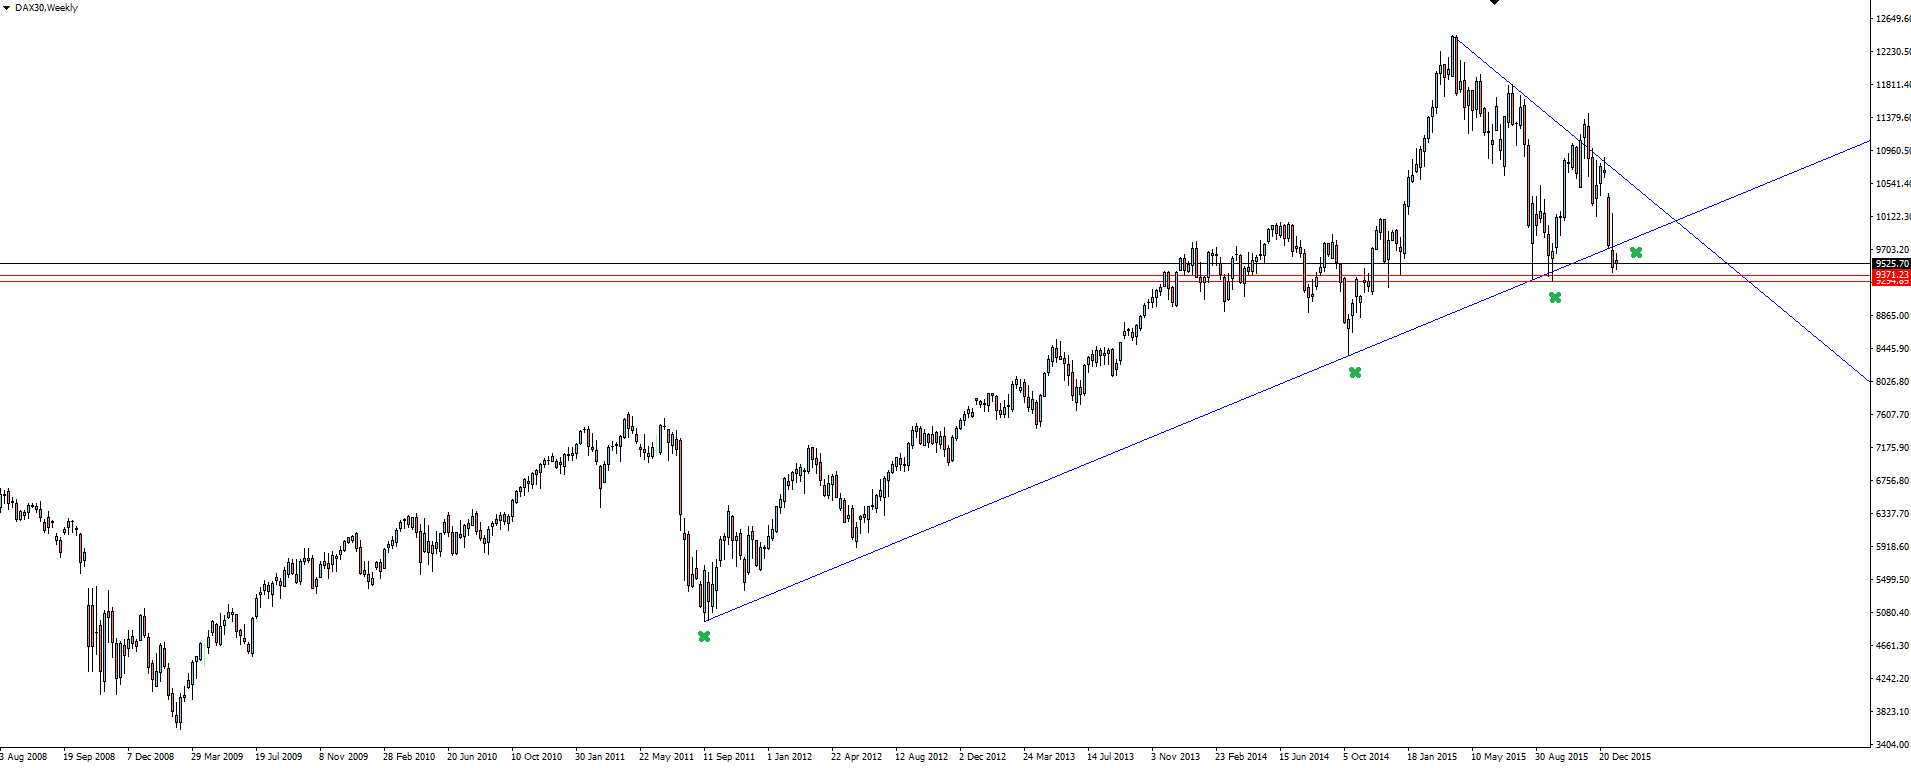
DAX30 Weekly:
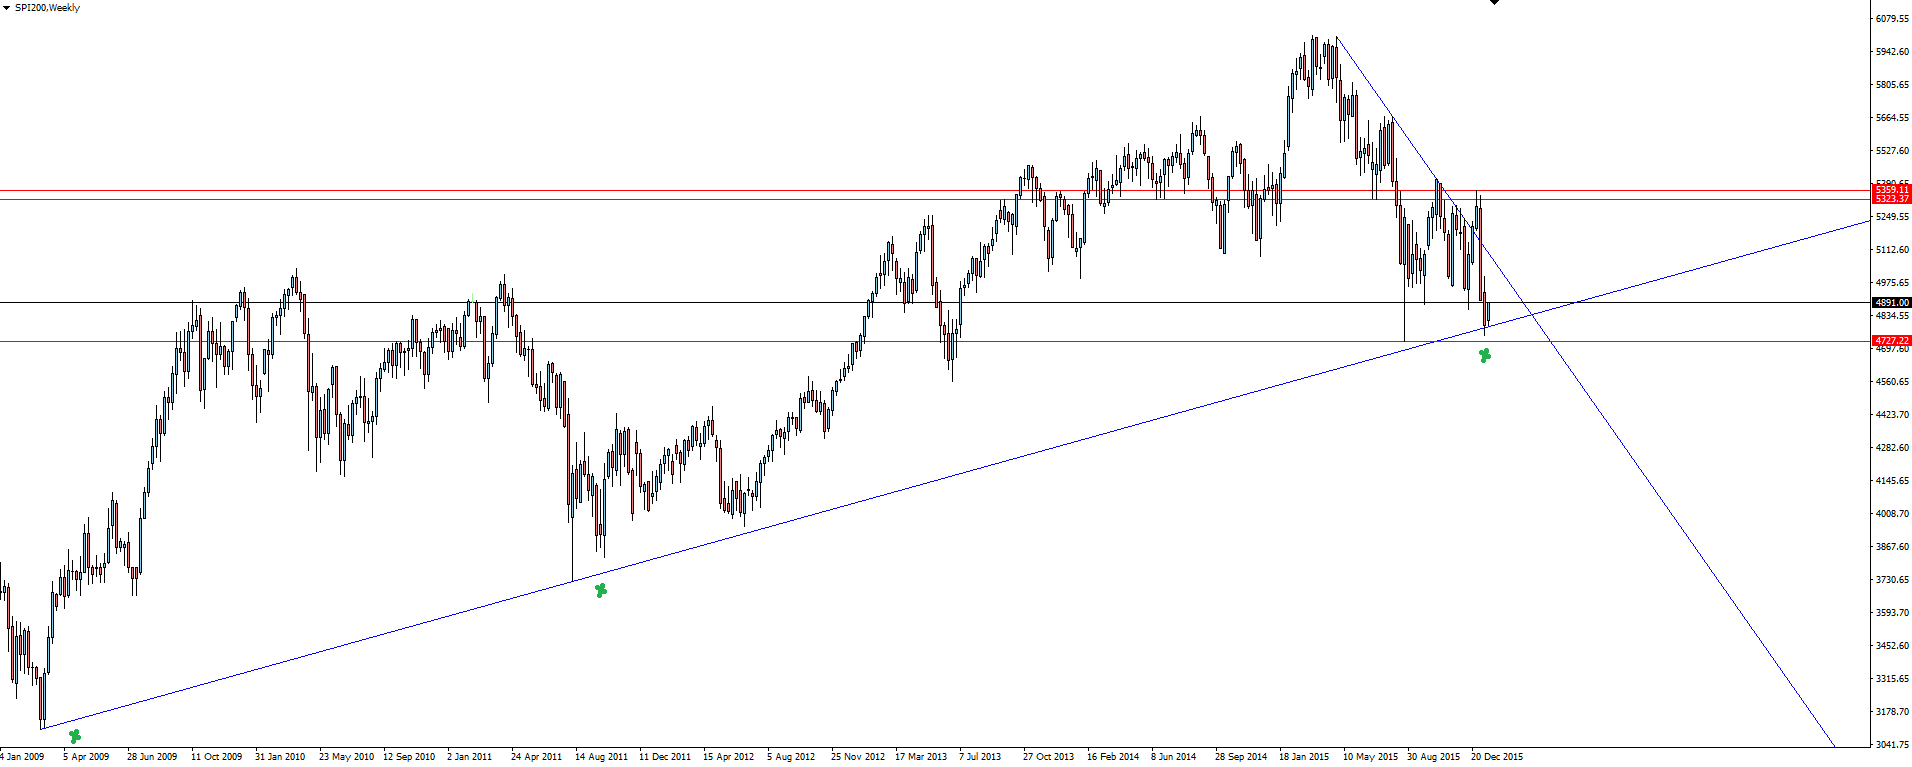
SPI200 Weekly:
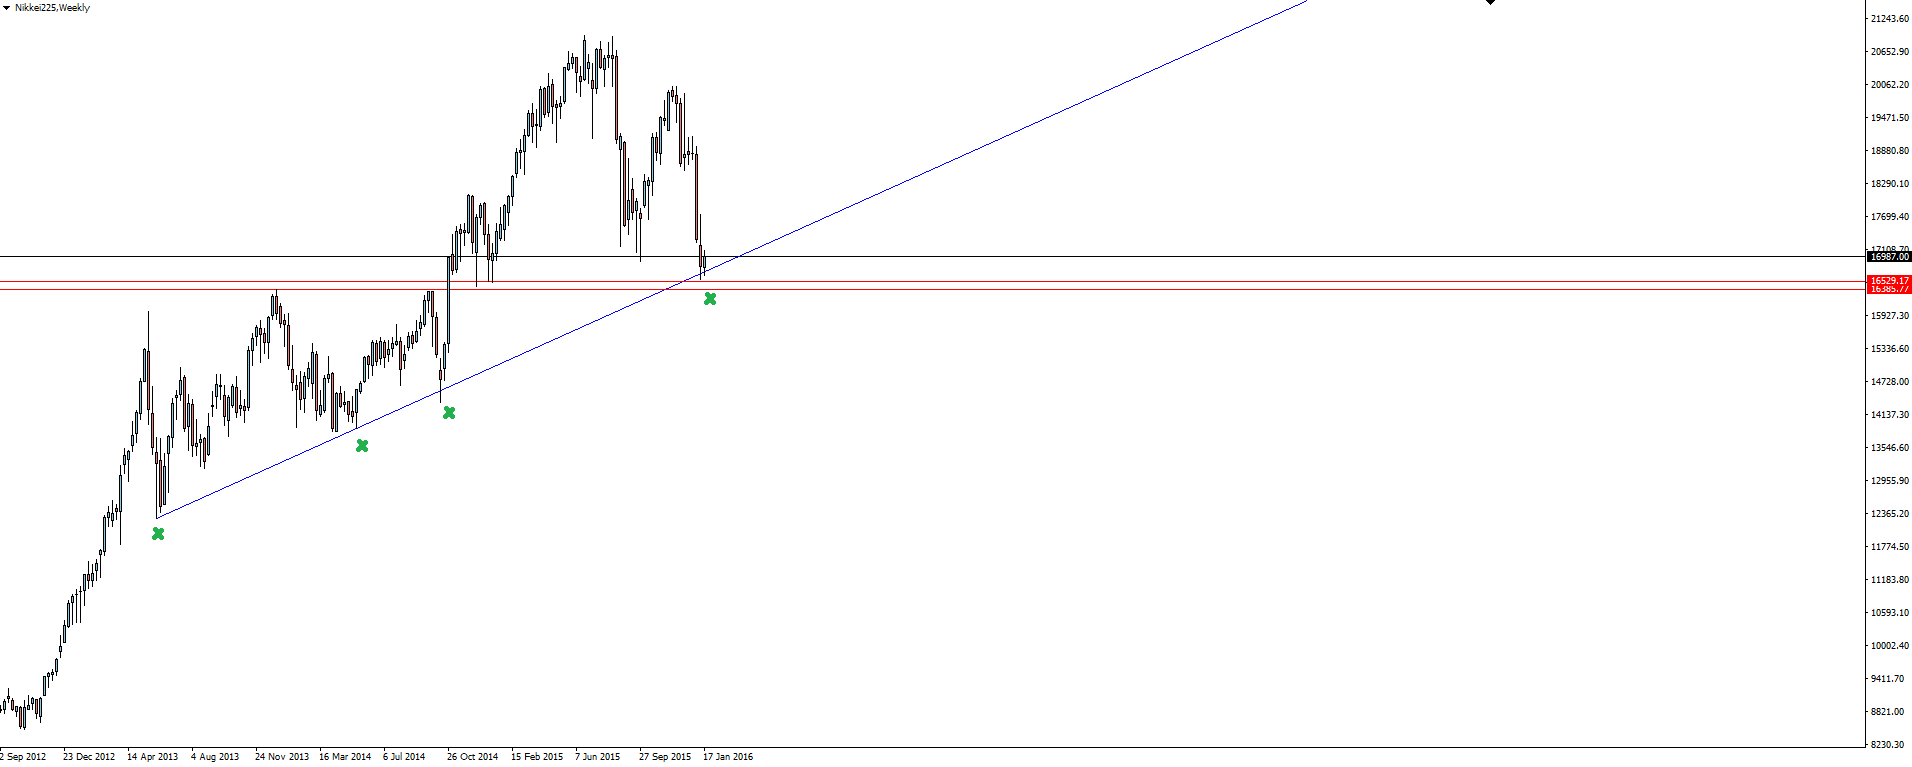
Nikkei 225 Weekly:
Click on chart to see a larger view.
Traditionally, markets take their lead from the US and in this case we see the S&P 500 chart is still sitting above support. If that level goes, you’re going to see stops going off galore and the potential for some serious technical damage being done throughout stock markets worldwide.
I can see the headlines of ‘Bullish Trend Officially Over’ flashing red across CNBC screens already!
Risk Disclosure: In addition to the website disclaimer below, the material on this page prepared by Australian Forex Broker Vantage FX Pty Ltd does not contain a record of our MT4 platform prices or solicitation to trade. All opinions, news, research, tools, prices or other information is provided as general market commentary and marketing communication – not as investment advice. Consequently any person opening a trading account and acting on it does so entirely at their own risk. The experts writers express their personal opinions and will not assume any responsibility whatsoever for the actions of the reader. We always aim for maximum accuracy and timeliness, and Vantage FX shall not be liable for any loss or damage, consequential or otherwise, which may arise from the use or reliance on this service and its content, inaccurate information or typos. No representation is being made that any results discussed within the report will be achieved, and past performance is not indicative of future performance.
