On its face, the market's performance in January looked boring, with some modest declines. In reality, it was anything but.
Consider the many risks investors had to weather during the course of January:
- Donald Trump insisting he didn't lose the Presidential election.
- A riot/invasion of the US Capitol Building by right-swing insurgents which left five people dead.
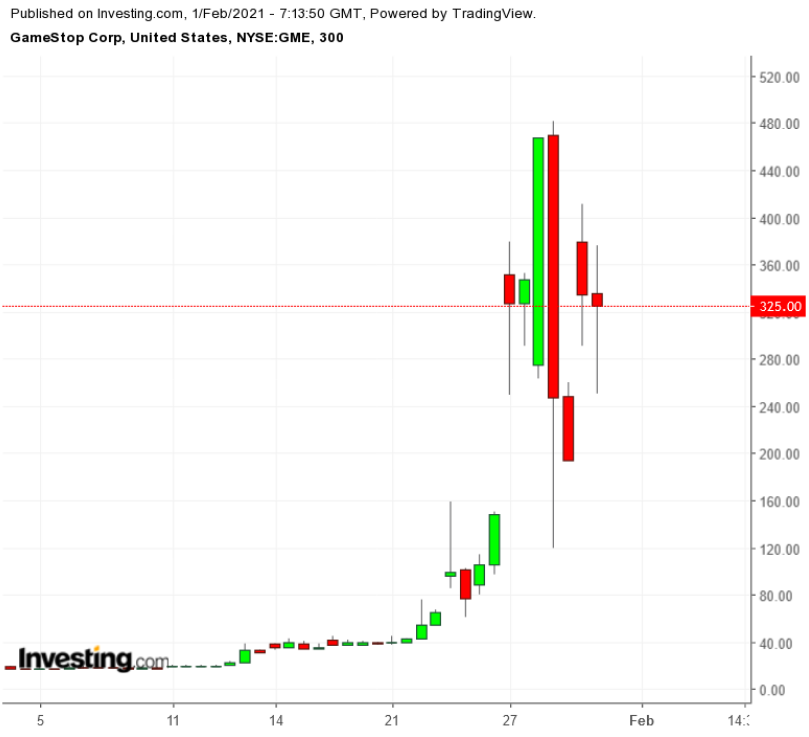
- An astonishing short-squeeze aimed at short-seller hedge funds by small investors banding together on Reddit, who took aim at the big funds and their massive bets that shares of GameStop (NYSE:GME), AMC Entertainment (NYSE:AMC), BlackBerry (NYSE:BB) and others would continue to sink.
- A nasty, abrupt round of selling during the final week of the month that wiped out the monthly gains for all the major indices.
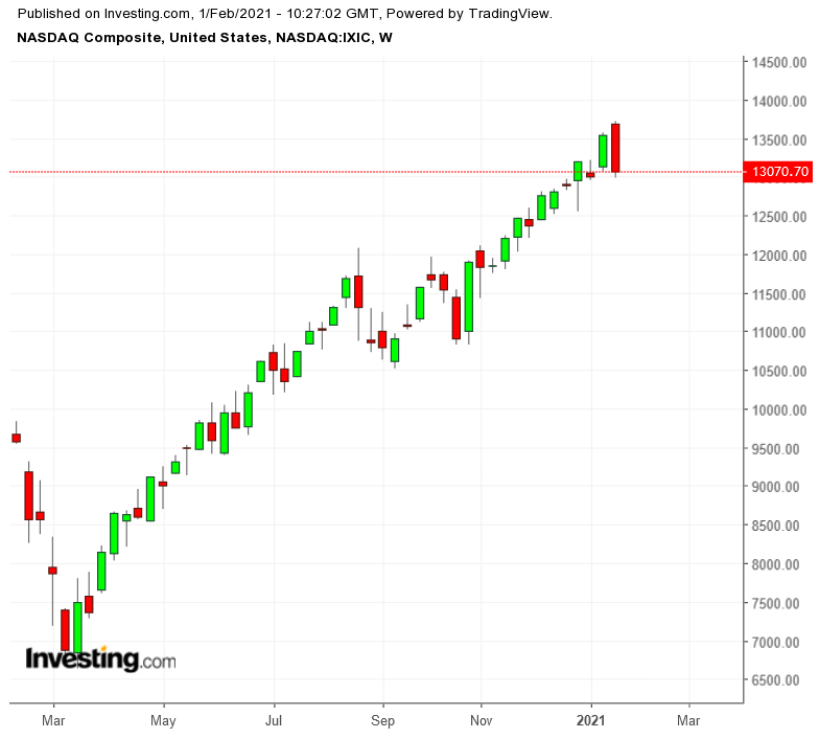
The S&P 500 fell 1.1% in January—thanks to last week's 3.3% slump. The Dow Jones Industrials dropped 2% (after a 3.3% decline on the week). And though the NASDAQ Composite ended January up 1.4%, it tumbled 3.4% on the week.
The index performances for the month may not be the end of the world, of course. First, futures activity ahead of Monday's trade suggests U.S. stocks will open higher.
Moreover, the indices had similar performances a year ago, mostly because they had reached pricey levels as 2020 opened. Then the COVID-19 virus erupted, battering markets everywhere before a bottom was reached in late March.

But at year-end, despite the virus and a bitter U.S. election, along with enormous volatility, stocks were sitting at or near all-time highs. The NASDAQ's 43.6% annual gain was its best since 1999.
The virus will be around for the rest of the year. And so will the volatility.
Bulls Aren't Dead Yet
But the context for volatility in 2021 will be a little different. There is now a new U.S. president in Joe Biden. The pandemic is a known reality, although efforts to control it have been constrained by its strength and mysterious varients that add to it complexity. The political environment in the United States exploded in violence with the Jan. 6 insurrection at the Capitol and is probably best described as still fraught.
At the same time, even if stocks began 2021 richly priced, one does not sense a lot of fear among really big money that valuations are too crazy.
Indeed, investor appetite for stocks has remained strong. For much of the fall, 150 or so stocks a day were hitting new 52-week highs according to data from Investing.com and Barchart.com. In early- to mid-January the number was surging above 400 and even nearing 800. The past week's sell-off finally depressed the counts.
GameStop Wars
It is not clear how or if the pullback in the last week applied to participants in the battle between the short sellers of GameStop, AMC, Bed Bath & Beyond (NASDAQ:BBBY) and others vs. small investors. This brigade of retail investors, led by a group of stock jockeys who banded together on Reddit's WallStreetBets, bought the stocks and forced shares higher.
The effect of the buying—usually via options to minimize cash outlay—resulted in staggering gains for some stocks. And disaster for short sellers, primarily hedge funds.
GameStop finished the month of January up 1,625%. If you bought the stock when it hit its 52-week low of $2.57 on April 3, 2020, the gain to date would be 12,546% BEFORE taxes.
Bed Bath & Beyond jumped 113% in January alone. AMC Entertainment, the movie-theater operator, was up 525% in January. Between the end of 2016 and the end of 2020, the shares had fallen 93.7%.
The buying forced investors who had gone short on these stocks to buy heavily to cover growing losses.
A short seller borrows shares from a broker and sells them, hoping the price will fall. The profit comes from buying the shares back at the lower price and returning them to the broker. If the price goes up during the trade, the investor must put up more collateral to hold the position.
Melvin Capital, a big and heretofore successful New York hedge fund that had a big short position in GameStop lost 53% in January and needed a bailout of some $1.2 billion, The Wall Street Journal reported Sunday.
Still, as big as Melvin Capital's losses are, they probably are not big enough to tank the market.
That's because the Federal Reserve is not going to boost interest rates this year and probably not in 2022 either, as the central bank continues working to get the US economy moving once the COVID-19 virus is brought under control.
If that forces many savers or cautious pension funds to become reluctant investors, so be it.
Looking Across The Market
GameStop and the gang from Reddit were not the only thing that happened during month. In fact, investors, who had started buying up lesser-known mid-cap and small-cap stocks continued their buying during January.
The Russell 2000 Index rose 5% on top of an 8.5% boost in December.
Among the stock groups that worked best in January were:
Biotechs. Especially Moderna (NASDAQ:MRNA), whose anti-COVID-19 vaccine is now being distributed (if slowly) along with a vaccine from Pfizer (NYSE:PFE). Moderna was up 65% in January, tops among NASDAQ 100 stocks, after rising 434% in 2020. In addition, Novavax (NASDAQ:NVAX) jumped 98% as testing of its rival vaccine continues. It is effective against more strains of the coronavirus but not so much against a South African variant.
Energy stocks. These showed gains, building on rising crude prices. West Texas Intermediate crude, the benchmark U.S. oil, surged above $50 as Saudi Arabia, Russia and other allies of the Organization Petroleum Exporting Countries agreed to production cuts to end a ruinous price war.
Especially strong were oil and gas production stocks. The SPDR® S&P Oil & Gas Exploration & Production ETF (NYSE:XOP) rose 9.95%, after jumping 39% in the fourth quarter of 2020. The ETF's top holdings include Diamondback Energy (NASDAQ:FANG), up 17.1% for the month and Occidental Petroleum (NYSE:OXY), up 15.9%.
Also showing strength were small-caps, chip stocks and home builders.
The Philadelphia Semiconductor Index (SOX) was up 3.3%.
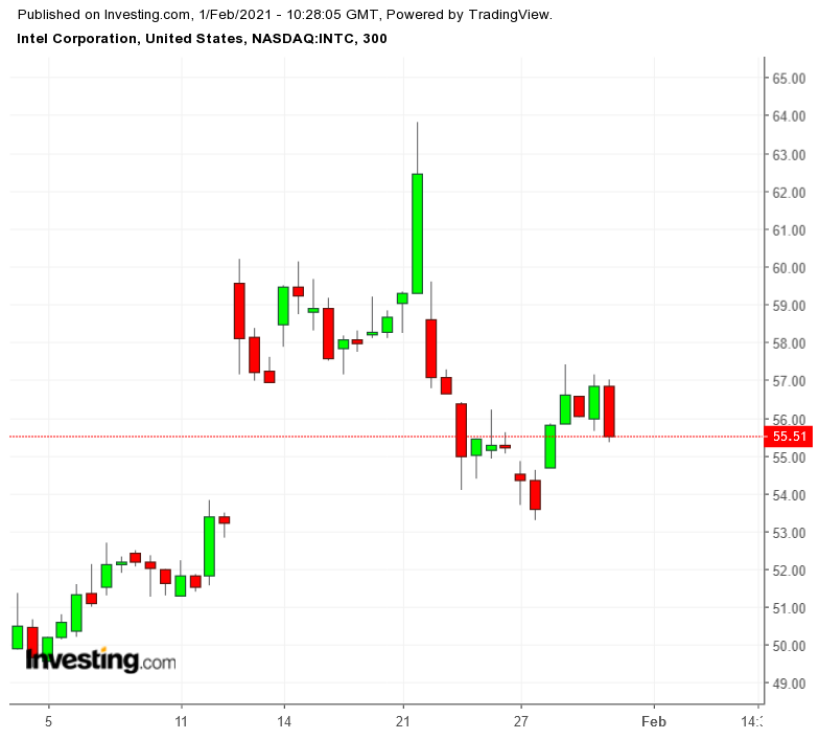
Among the biggest reasons for the index's strength: Intel (NASDAQ:INTC) which was up 11.4%.
Big techs, however, offered mixed performances.
Microsoft (NASDAQ:MSFT) and Google parent Alphabet (NASDAQ:GOOGL) were up about 4.3%. Microsoft hit 52-week and closing highs on Thursday. Alphabet reached 52-week and closing highs on Tuesday.
Apple (NASDAQ:AAPL), however, was down slightly on the month, despite blow-out first-quarter earnings and hitting new highs on Jan. 25.
Netflix (NASDAQ:NFLX) and Amazon (NASDAQ:AMZN) both slipped about 1.56%. Their Friday closes were about 10% below their 52-week highs.
Tesla (NASDAQ:TSLA), which joined the S&P 500 in December, was up 12.45% on the month, a relatively modest gain. But it briefly touched $900.40 on Jan. 25 and finished the day at a record $880.80. The shares were up 24% in December and 46.3% in November alone.
An interesting tech gainer was Illumina (NASDAQ:ILMN), the maker of gene-sequencing equipment, up 15.25%.
And the A and C shares of media company Discovery (NASDAQ:DISCA), (NASDAQ:DISCK) were the top S&P 500 performers, up 37.7% and 33.7%, respectively. Next was media giant ViacomCBS (NASDAQ:VIAC) up 30.2%.
Travel and leisure stocks, which have been highly vulnerable to the pandemic, had weak months.

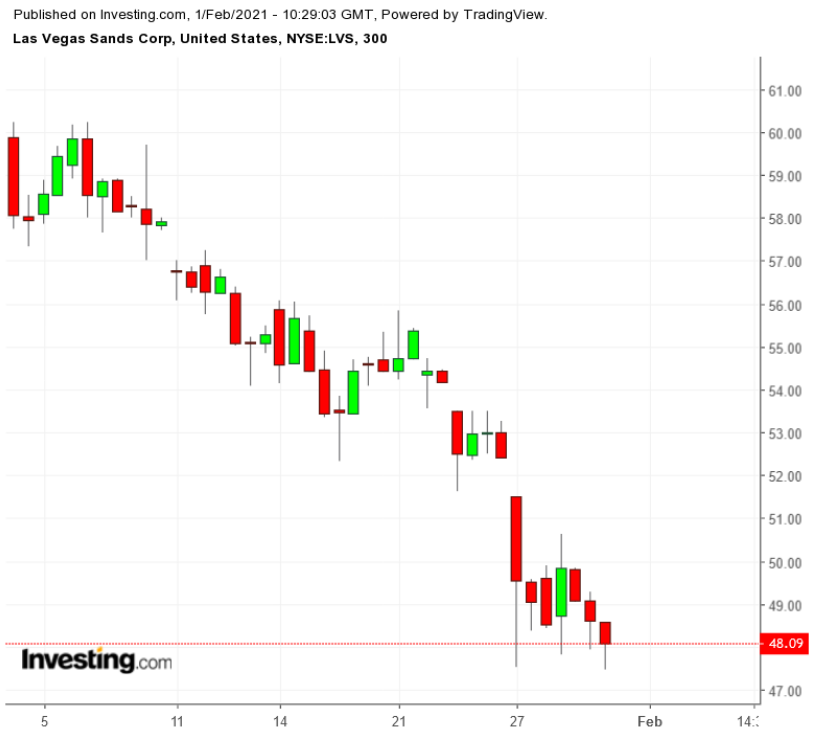
Casino operator Las Vegas Sands (NYSE:LVS) was the worst performing S&P 500 stock, down 19.3%. The death of CEO Sheldon Adelson may have hurt the shares as well.
Rival Wynn Resorts (NASDAQ:WYNN) dropped 11.8%. Cruise operator Carnival (NYSE:CUK) Corporation (NYSE:CCL) fell 13.8%—the pandemic has essentially halted the company's global operations.
The Inflation Question
As of Friday, the 10-year Treasury yield was at about 1.1%. On Jan. 6, the yield closed above 1% for the first time since Mar. 19. Is that a signal that inflationary forces are about to be unleashed and will the Fed push rates higher to stop it?
The short answers: probably not and no.
Chairman Jerome Powell was clear in a news conference last week that getting the economy moving is his and the Central Bank's top priority. Ultimately, the Fed wants inflation to hover around 2% a year. It is not there now, and the Fed is prepared to let it go a little higher to get the long-run rate at 2%.
That is good for stocks, for auto and home buyers, for companies seeking to expand. As for the current GameStop market mayhem, Powell and the US central bank aren't concerned, at least not at this point. As the Fed chief noted during the previous week's press conference, “I would say that financial stability vulnerabilities overall are moderate.”


