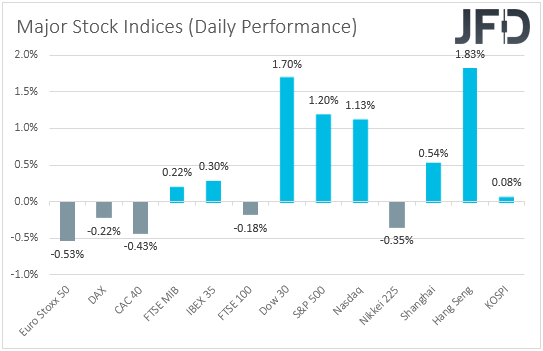
Most major EU indices traded lower on Monday, but the US ones traded in the green, perhaps as US participants held their longs for a while more after the much-better-than-expected US employment data for May. Overall, it seems that investors are reluctant to assume a clear direction ahead of the FOMC decision, due to be announced tomorrow.
EU SHARES DOWN, US ONES UP AHEAD OF FED DECISION
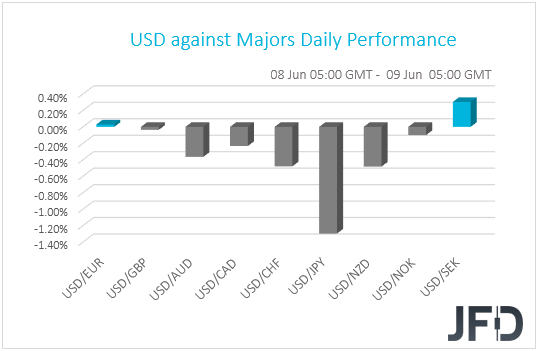
The dollar traded lower against the majority of the other G10 currencies on Monday and during the Asian morning Tuesday. It lost the most versus JPY, NZD, CHF and AUD in that order, while it eked out some gains only against SEK. The greenback was found virtually unchanged versus EUR and GBP.
The weakening of the dollar suggests that markets continued trading in a risk-on fashion yesterday, but the fact that the yen was the main gainer points otherwise. Thus, in order to clear things up, we prefer to turn our gaze to the equity world. There, most major EU indices closed slightly in the red, dragged by losses in technology and healthcare stocks. That said, the US session was marked with much more optimism. All three of Wall Street’s main indices gained more than 1.0%, with Nasdaq hitting a new record high. At this point, it is worth mentioning that the cash index of Nasdaq 100 managed to enter unchartered territory already on Friday. The upbeat morale rolled somewhat over into the Asian session today. Although Japan’s Nikkei 225 slid 0.35%, China’s Shanghai Composite and Hong Kong’s Hang Seng are up 0.54% and 1.83% respectively.
It seems that investors were somewhat indecisive ahead of Wednesday’s FOMC decision. Participants in the EU markets may have decided to lock some profits ahead of the event, while US and Asian traders may have remained willing to hold their longs for a while more, perhaps due to Friday’s much-better-than-expected US jobs report. The report revealed that the US economy added 2.51mn jobs instead of losing 8.0mn as the forecast pointed, with the unemployment rate falling to 13.3% from 14.9%, beating estimates of a surge to 19.7%. This suggests that the worst with regards to the coronavirus is behind us, but it remains to be seen whether Fed officials will share that view as well.
If they do, this could help equities and risk-linked assets to continue trending north, as investors abandon safe havens. Despite the recent tensions between China and the US, as well as the civil unrest in the US, market participants may have been placing more bets over a quicker-than-previously-thought global economic recovery, as governments around the world keep easing the restrictive measures adopted a couple of months ago aimed at controlling the fast-spreading coronavirus. Among currency pairs, despite the latest recovery in the yen, the ones that may perform better in such an environment may be those consisting of a risk-linked currency and a safe haven, like AUD/USD, AUD/JPY, NZD/CHF etc.
NASDAQ 100 – TECHNICAL OUTLOOK
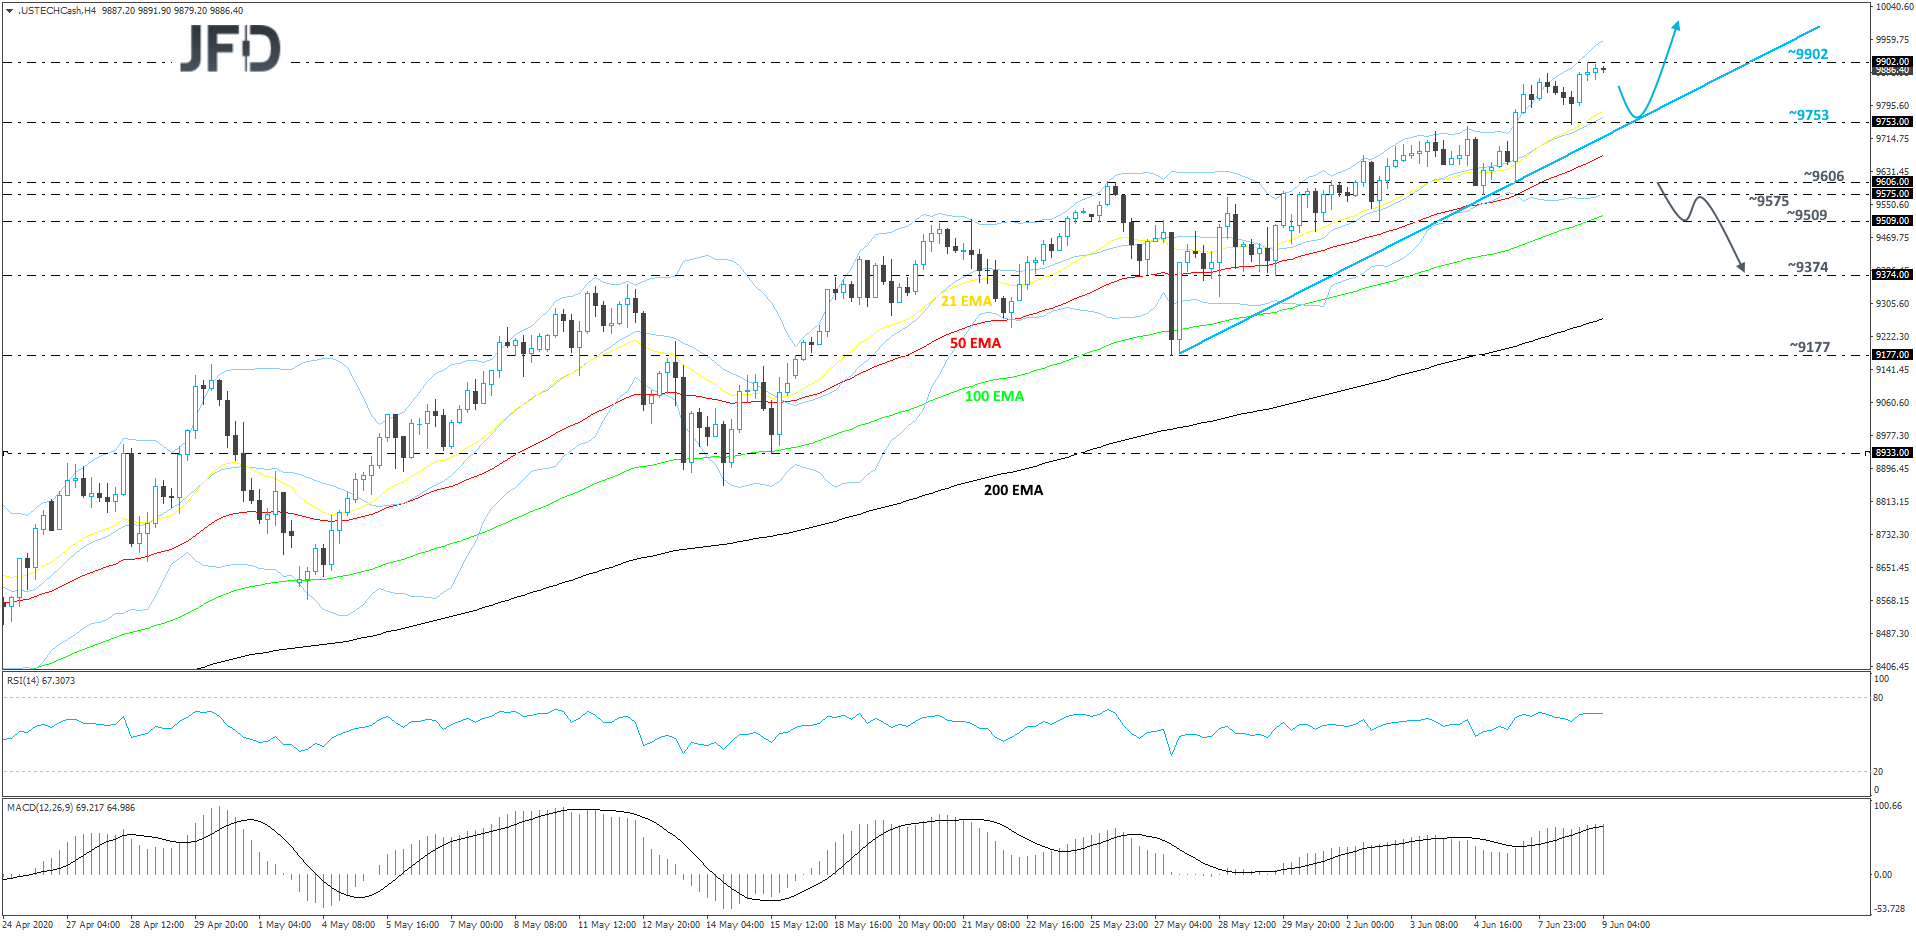
Nasdaq 100 continues to show the best performance among major indices. The US technology index, during the past few trading sessions, kept forming new all-time highs. For now, the price is still balancing above a short-term tentative upside support line taken from the low of May 27th. Although we may get a small correction given the strong up move, as long as the price is floating above the upside support line, we will see decent chances for another leg of buying.
If yesterday’s high, at 9902, manages to withstand the bullish pressure for now, the price may correct slightly lower. It might slide to the 9753 hurdle, which is the highest point of February, or the index could test the aforementioned upside line. If that line stays intact, Nasdaq 100 may rebound and travel back towards the current all-time high, at 9902, a break of which would confirm a forthcoming higher high and place the index in the uncharted territory.
Alternatively, if the aforementioned upside line breaks and the price falls all the way below the area between the 9606 and 9575 levels, marked by the lows of June 5th and 4th respectively, this could trigger even more selling. Nasdaq 100 could travel to the 9509 zone, a break of which might set the stage for a drift to the 9374 level, marked by the lows of May 26th and 29th.
AUD/USD – TECHNICAL OUTLOOK
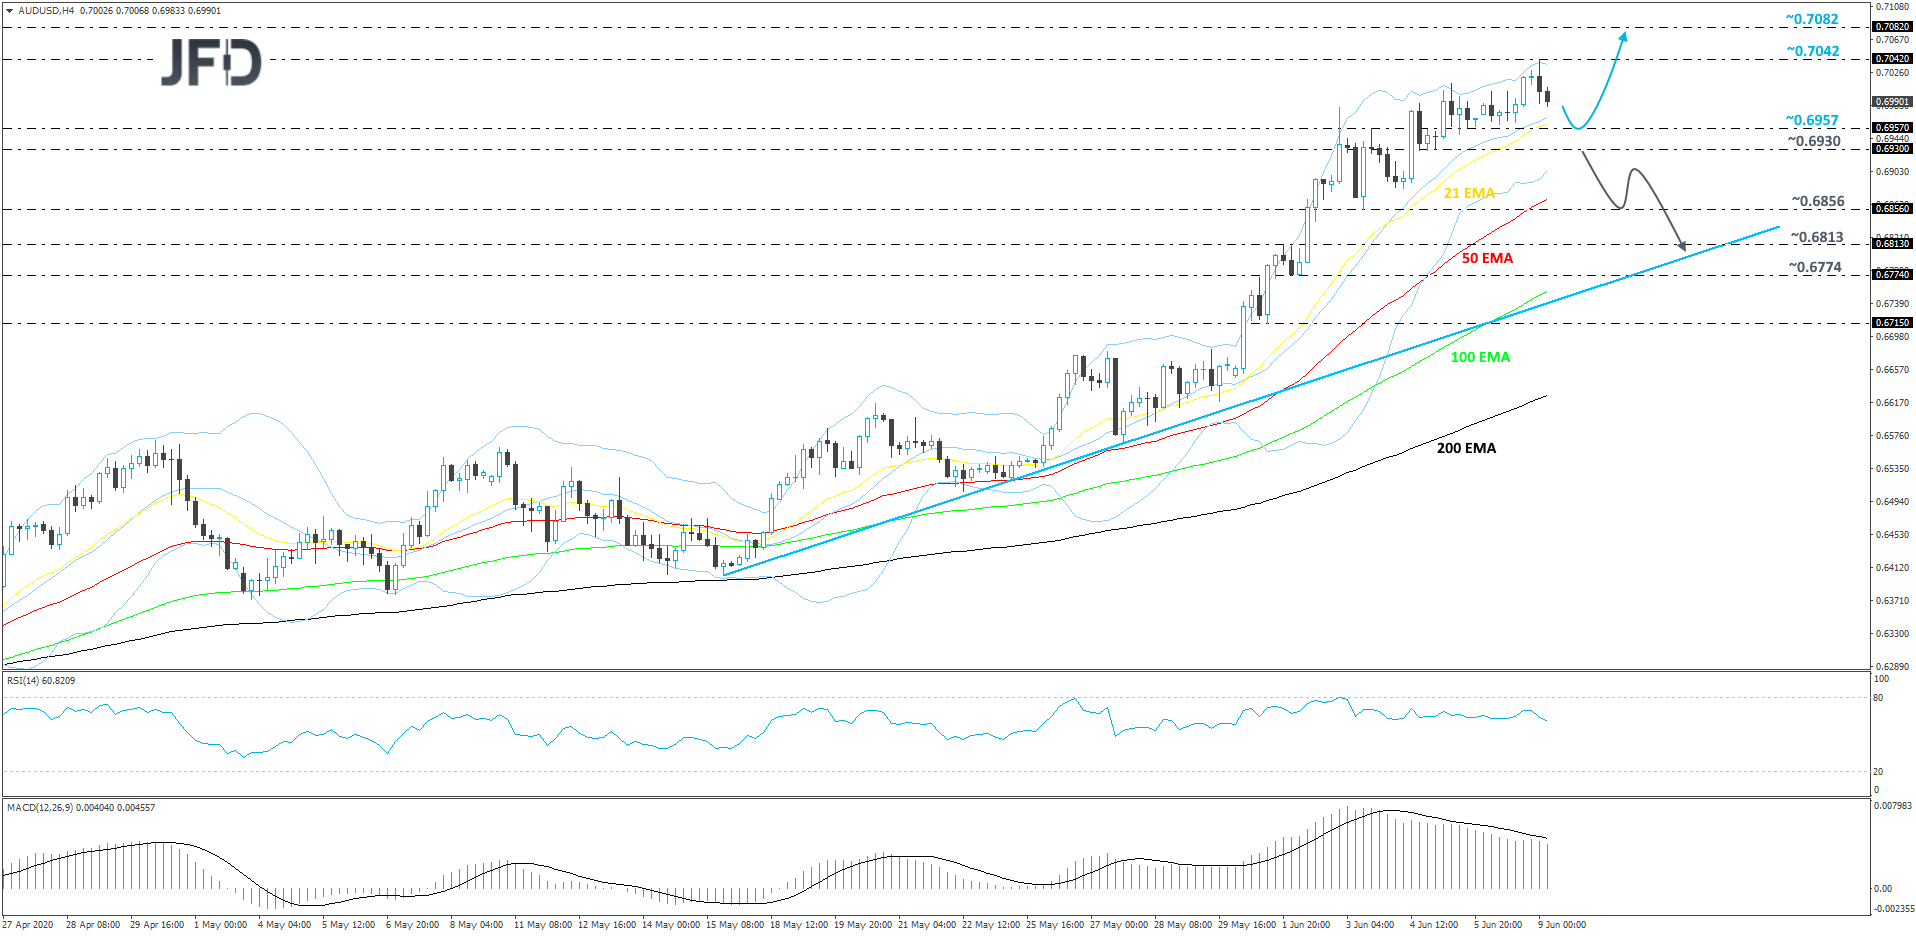
After hitting a new high this year, at 0.7042, AUD/USD started correcting a bit lower. The pair still remains above its short-term upside support line taken from the low of May 15th. Although the rate had quite distanced itself from that line, we still need to see AUD/USD sliding a bit lower, in order to consider a larger correction lower. Until then, we will class the current setback as a small temporary correction and stay positive with the near-term outlook.
If the pair slides a bit lower, but gets a good hold-up near the 0.6957 zone, marked by an intraday swing low of June 5th, the bulls could take advantage of the lower rate and lift it up. AUD/USD might travel to the 0.7042 barrier once again, a break of which would confirm a forthcoming higher high and open the door to the 0.7082 level, which is the highest point of July 2019.
On the other hand, if the slide gets extended below the 0.6930 hurdle, marked by the low of June 5th, that may set the stage for a larger correction lower. AUD/USD could fall into the hands of even more seller, who may drive the rate down to the 0.6856 obstacle, a break of which might open the door for a test of the 0.6813 area, marked by the high of June 1st. Slightly below that area runs the previously-discussed upside line, which could provide additional support.
AS FOR TODAY’S EVENTS
During the European morning, Germany’s trade balance for April, Eurozone’s final GDP for Q1 and the bloc’s employment change for the quarter are due to be released. The German trade surplus is forecast to have declined to EUR 10.2bn from 12.8bn, while Eurozone’s final GDP is just expected to confirm its preliminary estimate, namely that the Euro-area economy shrank 3.8% QoQ during the first three months of 2020. The bloc’s employment change is expected to show that the Euro-area economy has lost 0.2% of jobs after gaining 0.3% in the last quarter of 2019.
Later, from the US, we get the JOLTs job openings for April, which are expected to have slid to 5.750mn from 6.191mn in March.
With regards to the energy market, the API (American Petroleum Institute) weekly report on crude oil inventories is coming out, but as it is always the case, no forecast is available.
Tonight, during the Asian morning Wednesday, we have Australia’s Westpac consumer sentiment index for June, for which there is no forecast available. China’s CPI and PPI rates for May are also coming out. The CPI is forecast to have slowed to 2.6% yoy from 3.3%, while the PPI rate is anticipated to have fallen further into the negative territory, to -3.3% yoy from -3.1%.
