Friday was a return to the selling which started the week; the Monday gap down and Friday's selling bound small gains into the gap. Friday's selling also brought with it channel breaks across many of the indices.
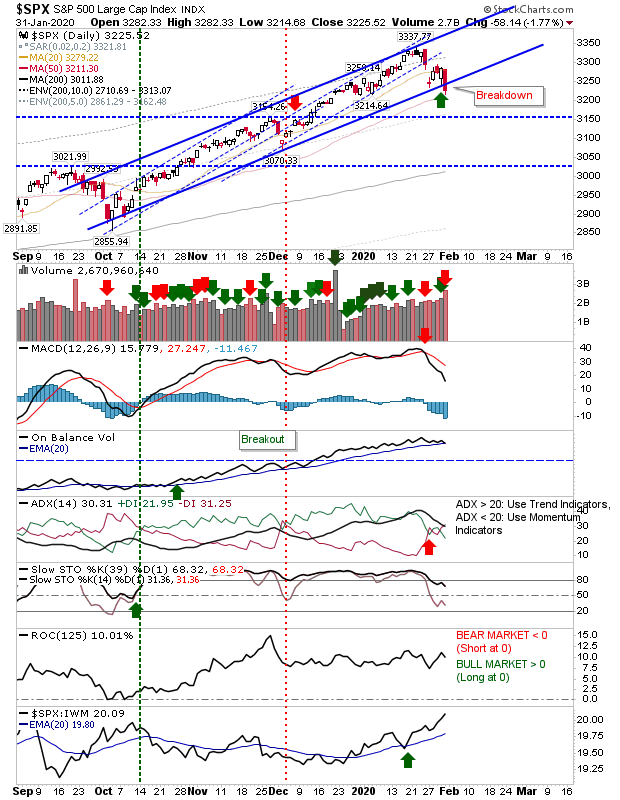
The S&P closed at its 50-day MA, at a point where the potential 'buy' signal from earlier in the week is now under pressure from a stop-out if the 50-day MA is breached. Technically, there was an acceleration in the MACD trigger 'sell' and an ADX 'sell' trigger, but offset by an acceleration in the relative performance against Small Caps.
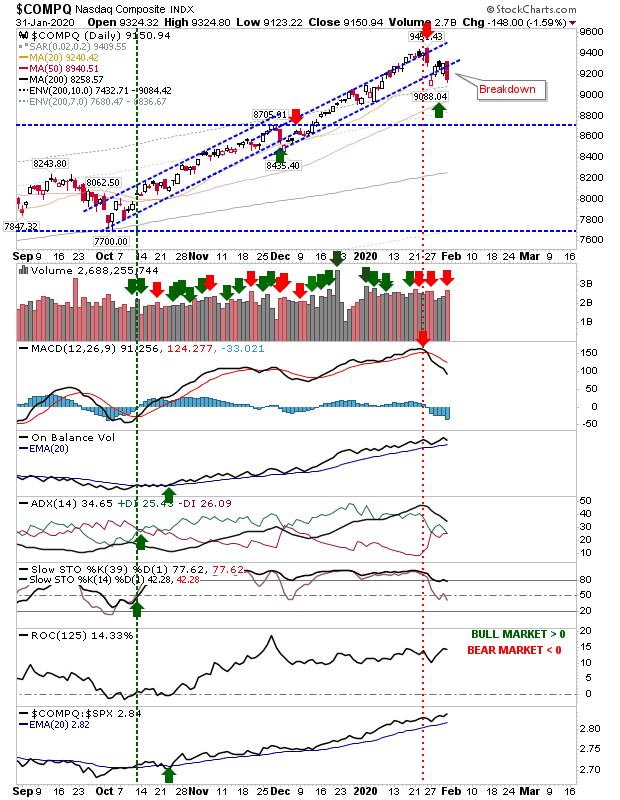
The NASDAQ is also out of its rising channel with a MACD trigger 'sell' but aside from this technical indicator, others are still okay. Having said that, there is still the 50-day MA to lean on and an area to look for buyers to step in.
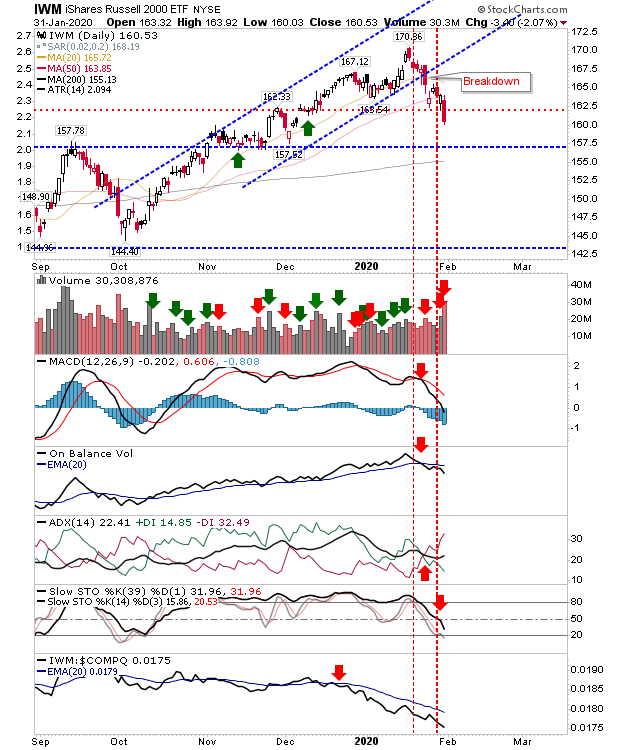
The Russell 2000 (via iShares Russell 2000 ETF (NYSE:IWM)) was one index which didn't enjoy the relief bounce of other indices, which left it vulnerable to the biggest loss on Friday—which was delivered by a 2% loss. Also, unlike other indices, technicals are net bearish.
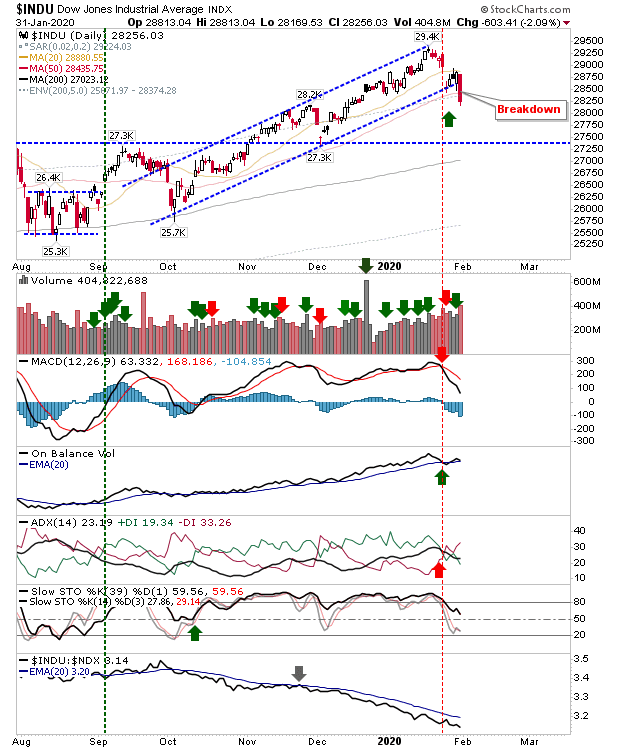
Tying with the Russell 2000 was the Dow Industrial Average. Friday's losses delivered a break of the channel and the 50-day MA. Technicals are left with a MACD 'sell' and an ADX 'sell'.
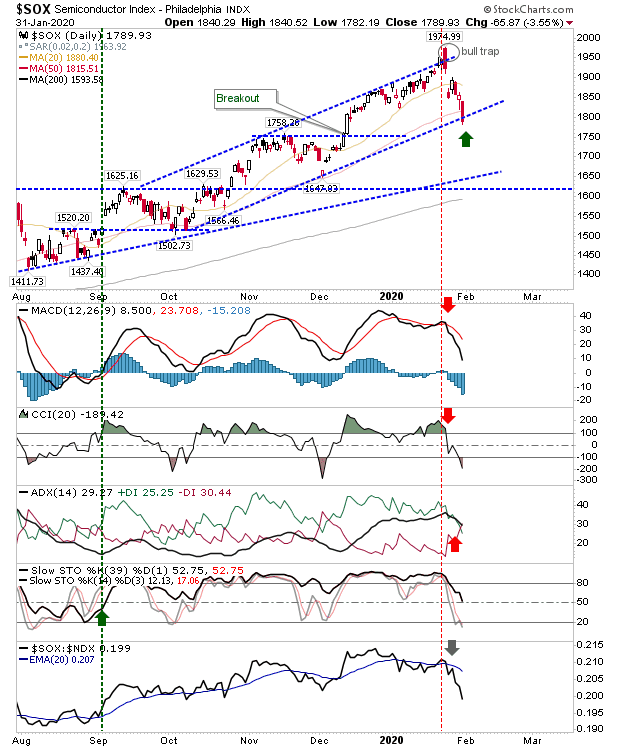
The Semiconductor Index took a 3.5% loss, which left it trading at channel support after its 'bull trap' quickly led to losses. There were 'sell' triggers for the MACD, CCI and ADX along with an acceleration in relative loss against the NASDAQ 100.
For today, bulls can still pull a rabbit out of the hat if there is a return inside channels and 'bull traps' emerge. However, the week closed as it opened—on a bearish note—and it's hard to see next week being much different.
