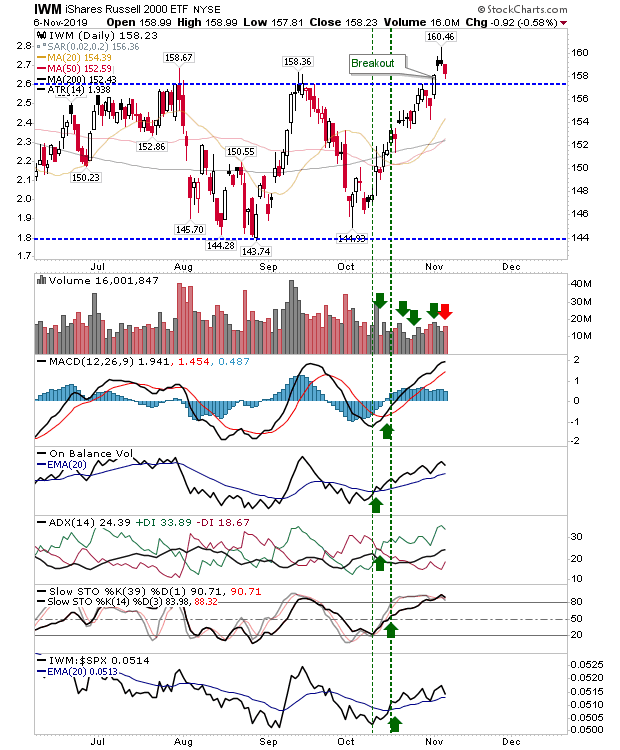
No real surprises yesterday but the most important aspect to the trading action was the fact index breakouts held for another day. Small Caps (via iShares Russell 2000 ETF (NYSE:IWM)) lost a little ground but didn't undercut the breakout level.
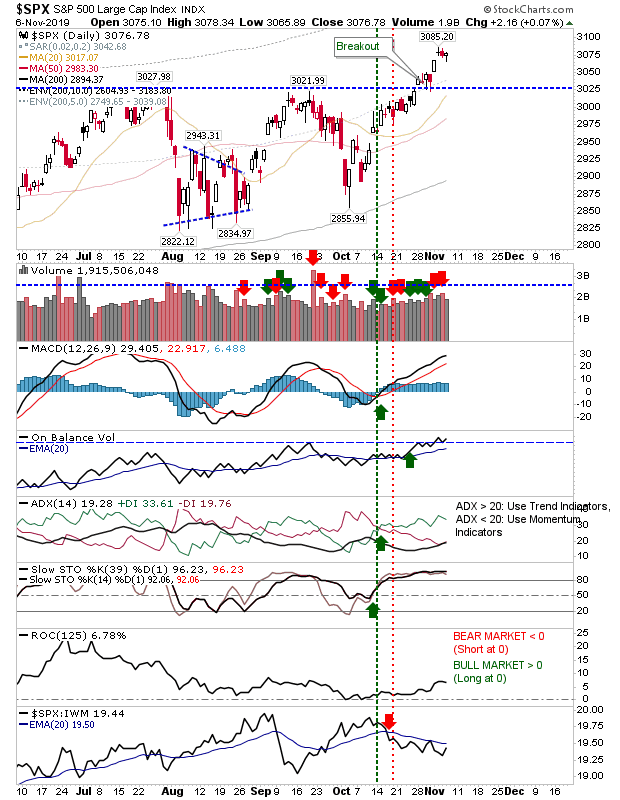
The S&P lost a little ground on the day but recovered to close with a small doji. Volume was light but this didn't reverse a supporting breakout in On-Balance-Volume. Other technicals are all bullish.
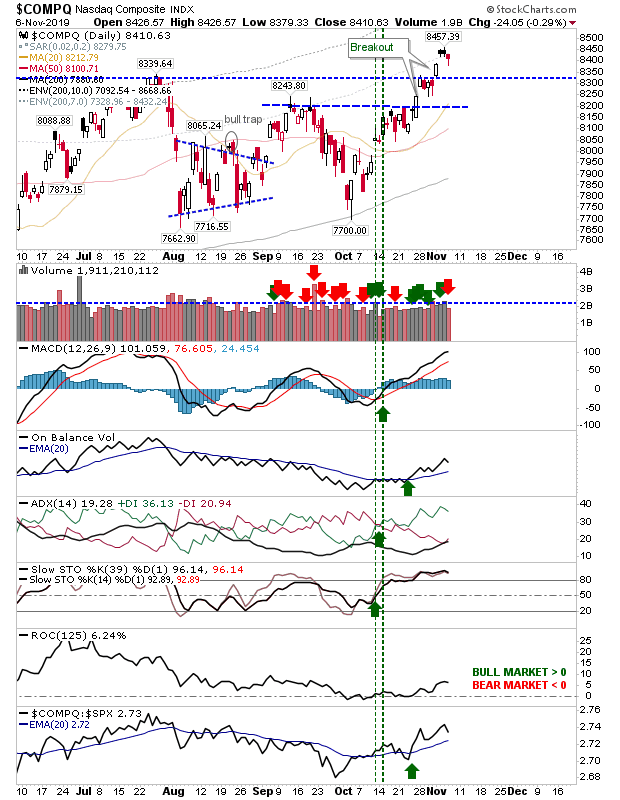
It was the same for the NASDAQ, as it closed with a bullish hammer on lighter volume. While the 'bullish hammer' candlestick is a positive, momentum must be oversold for it to be considered a bullish reversal, so further downside may follow as part of a potential breakout retest.
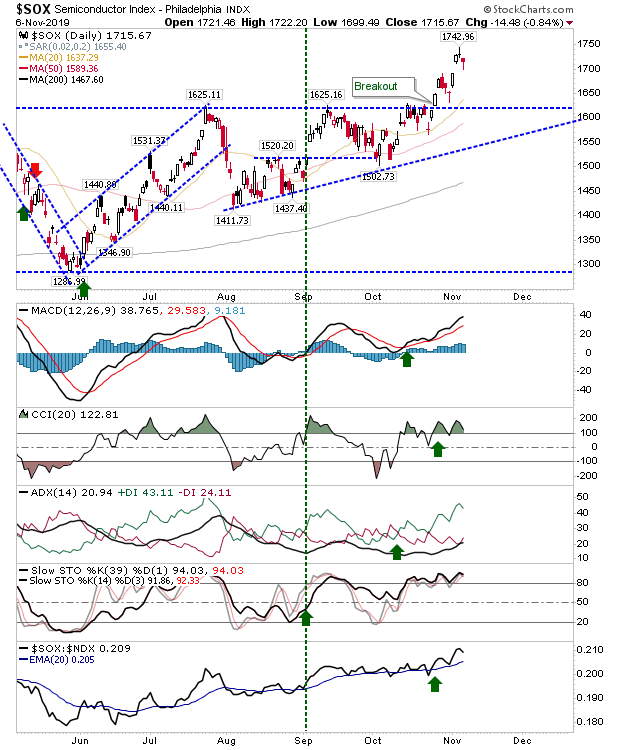
While the Semiconductor Index is enjoying a strong rally (note acceleration in relative performance against the NASDAQ 100), which will help the NASDAQ...
NASDAQ breadth metrics have reached possible resistance with technicals overbought.
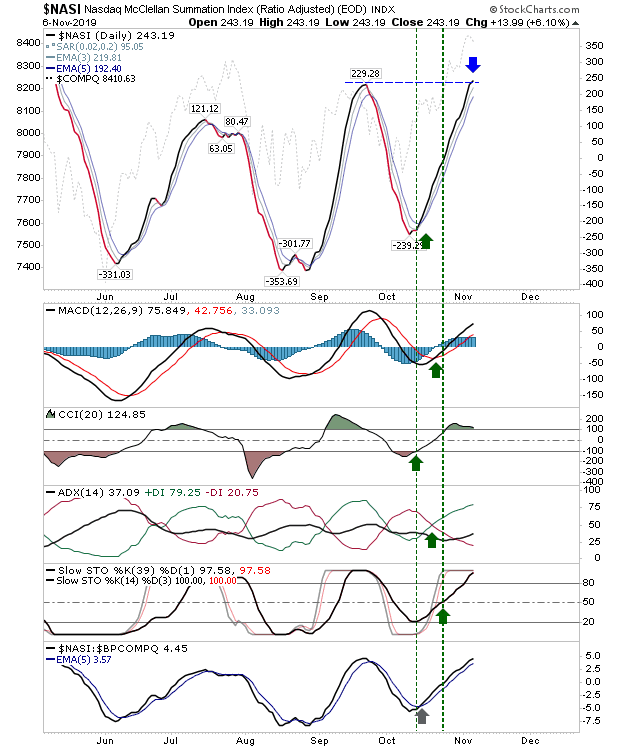
The Percentage of NASDAQ Stocks Above 50-day MA has reached a possible peak at 62%
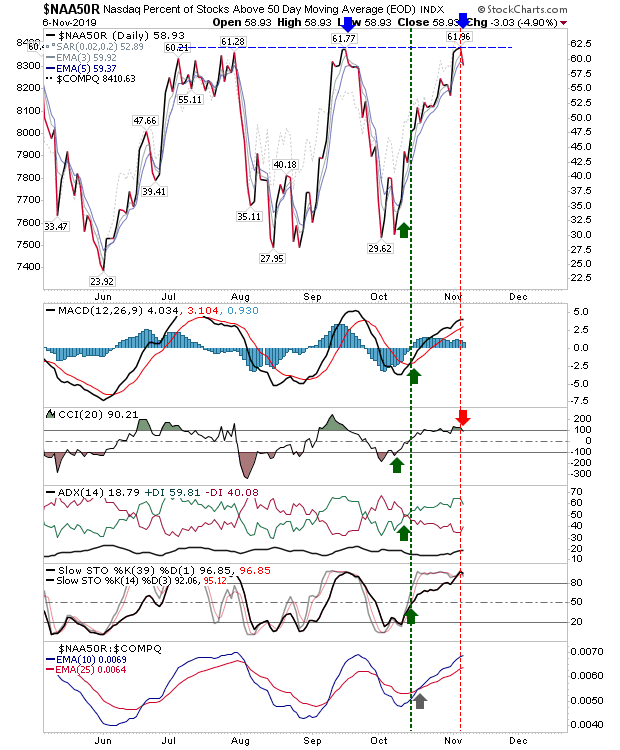
While I am liking this rally for the long term, breadth metrics (at least for the NASDAQ) suggest it may not all be plain sailing. If a period of weakness follows, it will be important for indices to retain their breakouts, even if this results in an extended sideways period of price action.
