Last week I did a piece called “Granny Retail Hangs Tough.” At the time I noted, “On the weekly chart, XRT is above the 200-week moving average, while her husband, Russell 2000 IWM is not.”
“Also, at the time I wrote, “XRT is in a weekly accumulation phase. Let that soak in. Furthermore, it is well outperforming our benchmark. And finally, our Real Motion indicator shows momentum has gained.”
But perhaps the most important statement was this:
“If XRT can clear …the 45.00 level in price on a weekly close, Gramps IWM and Transportation IYT, are likely to follow.”
Gramps not only followed, yesterday he took the lead!
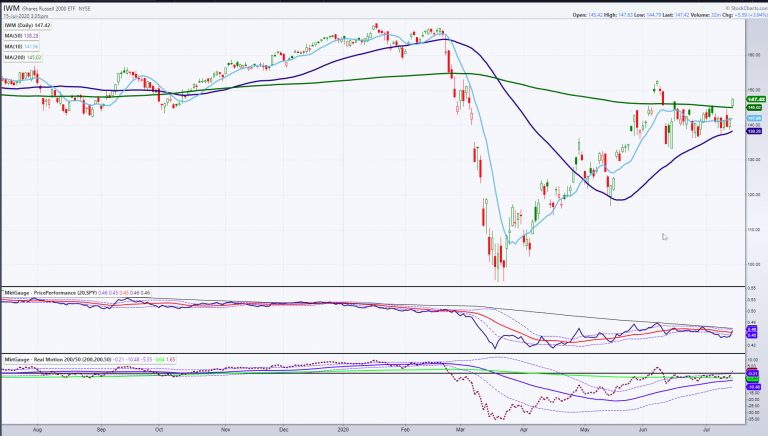
On Wednesday, IWM crossed the 200-DMA for the second time since the February crash.
The first time in early June, IWM gapped over the 200-DMA only to break hard back below it 3 days later. However, IWM proceeded to spend several weeks consolidating in a range between 137 and 145, never breaking down under the 50-DMA.
So, was yesterday any different? Two reliable indicators you see on the chart.
One, is the price performance benchmark, which IWM exceeded (outperformed) by a smidge.
The other is Real Motion, which was already declining when IWM ran over 150. Today, the RM indicator broke above the midpoint line (black).
But even better, is that RM crossed the 200-DMA before price did, acting as a leading divergence indicator.
Now, with price confirming momentum, we want to see a second day close above 146 or the 200-DMA.
The Russell 2000 represents the US economy through manufacturing.
As I have been writing about concerning the financial and retail sectors, “That is a better story for a projected improvement in the economy for the 4th quarter and beyond. The market is forward thinking.”
One thing I will add. I still believe in the stagflation scenario. This is why we should have fun, but also have a sound strategy as we plow through earnings season.
Key Levels
S&P 500 (SPY) 323.43 on watch or the early June high
Russell 2000 (IWM) Unconfirmed accumulation phase must confirm
Dow (DIA) Filled the gap to 270-signals more rotation into blue chips
KRE (Regional Banks) Unconfirmed recuperation phase. Needs a second close over 37.00
SMH (Semiconductors) 160 pivotal, 157.50 support
IYT (Transportation) Right to the 173 resistance
IBB (Biotechnology) New all-time high today, thanks in part to Moderna (NASDAQ:MRNA)
XRT (Retail) Cleared 45, now must hold
Volatility Index (VXX) Inverted hammer doji-forced selling so could spoil the party
Junk Bonds (JNK) 104.25 resistance 101.50
LQD (iShs iBoxx High yield Bonds) 135.65 support
