Technical Analsys
Technical Analysis OIL : 2019-04-29
US President Appeals to OPEC
Oil quotations fell by about 3-4% after US President Donald Trump called on OPEC to increase production. Will the correction of WTI quotations continue?
From its last low on December, it was up 56%. The local maximum was set on Tuesday, April 23rd. The main reason for such rapid growth was the decision of OPEC and independent producers to limit production from the beginning of 2019 by 1.2 million barrels per day (BVD), as well as US economic sanctions against Iran and Venezuela. In addition to Trump’s statement, the outlined correction in world oil prices was aided by rumors that the United States could soften its sanctions against Iran in order to increase supply in the oil market. The main factor of correction may be signals of a slowdown in the global economy. Therefore, oil quotations can respond to macroeconomic data and forecasts in the largest consumer countries.
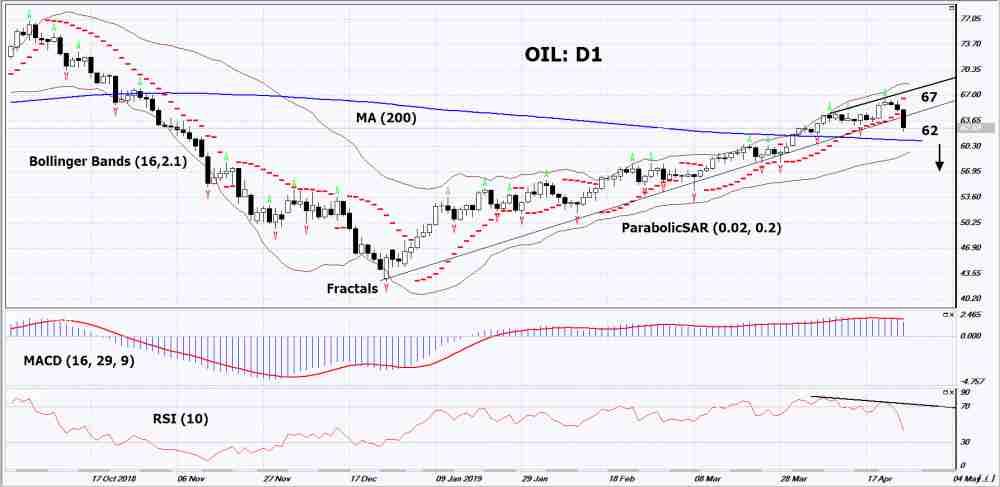
On the daily timeframe, OIL: D1 broke through the support line of uptrend. Most of technical analysis indicators have formed downtrend signals. A drop in prices is possible in the event of a slowdown in the global economy and an increase in oil production.
-
The Parabolic indicator gives a bearish signal.
-
The Bollinger bands expanded, indicating volatility increase. The top line slopes down.
-
The RSI indicator is below 50. It has formed a divergence to a decrease.
-
The MACD indicator gives a bearish signal.
The bearish momentum may develop in case oil will drop below its last minimum: 62. This level may serve as an entry point. The stop loss may be placed higher than the last upper fractal, the Parabolic signal and the maximum since October 2018: 67. After opening a pending order, we shall move the stop to the next fractal maximum following Bollinger® Bands and Parabolic indicator. Thus, we are changing the potential profit/loss to the breakeven point. More risk-averse traders may switch to the 4-hour chart after the trade and place there a stop loss moving it in the direction of the trade. If the price meets the stop level (67) without reaching the order (62), we recommend to close the position: the market sustains internal changes that were not taken into account.
Technical Analysis Summary
- Position Sell
- Sell stop Below 62
- Stop loss Above 67
Market Overview
Dollar weakens despite stronger than expected GDP data
US stock market rebounded on Friday boosted by stronger than expected GDP report. The S&P 500 rose 0.5% to record high 2939.88, ending 1.2% higher for the week. Dow Jones industrial advanced 0.3% to 26543.33. The Nasdaq gained 0.3% to fresh record high 8146.40.The dollar slipped despite a report the US economy grew at an above expected annual rate of 3.2% in the first quarter. The live dollar index data show the ICE (NYSE:ICE) US Dollar index, a measure of the dollar’s strength against a basket of six rival currencies, lost 0.1% to 98.02 and is lower currently. Futures on US stock indexes point to higher openings today.
DAX 30 outperforms European indexes
European stocks recovered on Friday supported by strong earnings and US GDP report. Both the EUR/USD and GBP/USD turned higher and continue climbing currently. The Stoxx Europe 600 Index added 0.2% led by healthcare and auto shares. The DAX 30 advanced 0.3% to 12315.18. France’s CAC 40 edged up 0.2% while UK’s FTSE 100 slipped 0.1% to 7428.19.
Hang Seng leads Asian indexes gains
Asian stock indices are mixed today. Nikkei 225 was closed for a holiday while yen turned lower against the dollar. China’s markets are mixed ahead of US Trade Representative Lighthizer and Treasury Secretary Mnuchin visit Beijing to resume trade negotiations: the Shanghai Composite index is down 0.8% while Hong Kong’s Hang Seng index is 1% higher. Australia’s All Ordinaries index is 0.4% lower as the Australian dollar continues its climb against the greenback.
Brent up
Brent futures prices are edging higher today. Prices fell sharply on Friday after President Trump demanded that OPEC raise output to offset the impact of US sanctions against Iran exports. Brent for June settlement fell 3% to close at $72.15 a barrel Friday, adding 0.3% for the week.


