
Today, the main event is likely to be the FOMC monetary policy decision. According to market chatter, the Fed may switch its bond purchases to more long-dated debt, and thus, it would be interesting to see whether this would be the case.
It would be also interesting to dig into the updated economic projections, in order to get an idea of how much of inflation overshoot the Fed is willing to tolerate before they start considering hitting the hiking button.
Investors Lock Gaze On The Fed Decision
The US dollar traded mixed against the other G10 currencies on Tuesday and during the Asian morning Wednesday. It gained versus SEK, EUR, CAD, CHF, and NOK in that order, while it underperformed against JPY, GBP, and NZD. The greenback was found virtually unchanged versus AUD.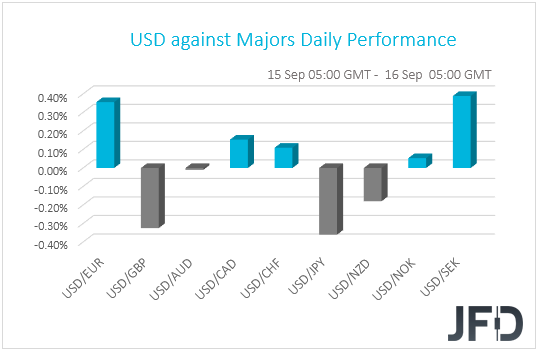
The strengthening of the yen suggests that markets traded in a risk-off fashion yesterday. However, the fact that the Kiwi was also among the gainers, points otherwise. Thus, in order to get a clearer picture with regards to the broader market sentiment, we prefer to turn our gaze to the equity world.
There, major EU and US indices traded in positive waters, with the only exception being the Dow Jones, which closed virtually unchanged. That said, investors’ appetite eased during the Asian morning today, perhaps as investors turned more cautious ahead of the FOMC decision later in the day.
Japan’s Nikkei closed virtually unchanged, while China’s Shanghai Composite, Hong Kong’s Hang Seng and South Korea’s KOSPI are down 0.36%, 0.20%, and 0.31%.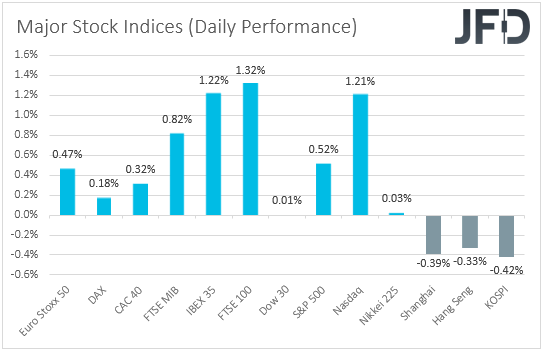
This will be one of the “larger” FOMC meetings, where, apart from the decision and the press conference, we also get updated economic projections and a new “dot plot”. A few weeks ago, speaking at the Jackson Hole economic symposium, Fed Chief Powell said that the Fed will now target a 2% average inflation and put emphasis on “broad and inclusive” employment, with the shift motivated by underlying changes to the economy, including lower potential growth, persistently lower interest rates and low inflation.
Although he added that the Committee is not tying itself to any particular method to define “average” inflation, this means that the Fed is willing to tolerate above 2% inflation for a while before raising interest rates, which implies extra-loose monetary policy for longer. What’s more, in the minutes of the latest FOMC gathering, it was revealed that additional accommodation may be required.
According to market chatter, officials may switch their Treasury purchases towards more long-dated bonds in order to keep long-term yields low, with expectations increasing amid a stalemate in government and congress talks over a new coronavirus-aid bill. Having said that though, we see decent chances for the Fed to refrain from acting at this gathering.
Last Friday, inflation data showed that both the headline and core CPI rates for August came in higher than expected, which combined with the decent NFP gains during the month, may allow officials to stay sidelined and monitor how the economic activity progresses from now onwards.
If this is the case, it would be interesting to see whether they are planning to alter their policy at one of the upcoming gatherings. Another point of interest would be the updated economic projections and the new dot plot. From those forecasts, investors could find out how much of inflation overshoot officials are willing to tolerate before they start considering any interest rate hikes.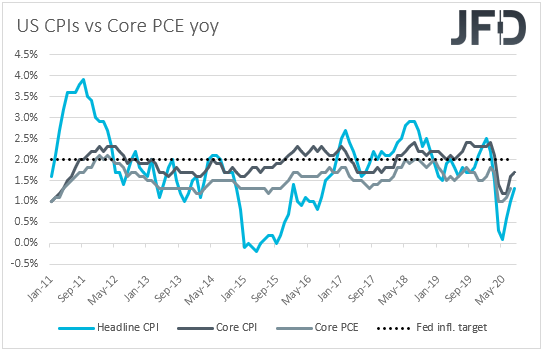
Now, in terms of market reaction, the US dollar could weaken, and equities could rise instantly, if the Fed decides to switch its bond purchases to more long-dated bonds. The opposite may be true if they refrain from doing so. However, in case they remain willing to act, and signal that rates will stay at present levels even if inflation rises well above 2%, any such reaction is likely to stay short lived. Eventually, the dollar could give up its decision-related gains, and equities may resume their recoveries. For any dollar strength or stock market weakness to be sustained, the Fed may need to signal that additional easing may not be required for the next few months and the new dot plot may have to point to at least a hike when, and if, inflation overshoots the target. Having said all that though, with what we have in hand at the moment, we see the last scenario as the least likely.
USD/JPY Technical Outlook
From around the beginning of August, USD/JPY continues to move sideways, roughly in a 180-pip range. The pair is currently resting near the lower bound of that range, at 105.20. If the sellers are able to push the rate below that hurdle, this would not only push USD/JPY outside of the range, but might also open the door to larger extensions to the downside, as a forthcoming lower low would be confirmed. However, until we see that that break, we will remain neutral.
If, eventually, USD/JPY does move below the aforementioned 105.20 zone, that may attract a few more sellers into the arena, as such a move could increase the pair’s chances of drifting further south. The rate might end up sliding to the 104.77 area, marked by the low of July 29th, a break of which could clear the way to the lowest point of July, at 104.18. The pair might get halted there temporarily, until the bulls and the bears figure out who will take control from there.
On the upside, if USD/JPY is able to crawl back above the 105.81 barrier, marked near the low of September 9th and the high of September 15th, that might help it attract a few extra buyers into the game. The pair may travel to the 106.30 obstacle, or even the 106.55 zone, marked by the current highest point of September, which could slow the acceleration down. That said, if the bulls are still feeling a bit more comfortable and are able to bypass that 106.55 hurdle, this might open the door for a push towards the upper side of the aforementioned range, which is between the 106.95 and 107.05 levels. Those levels mark the highs of August 28th and 14th respectively.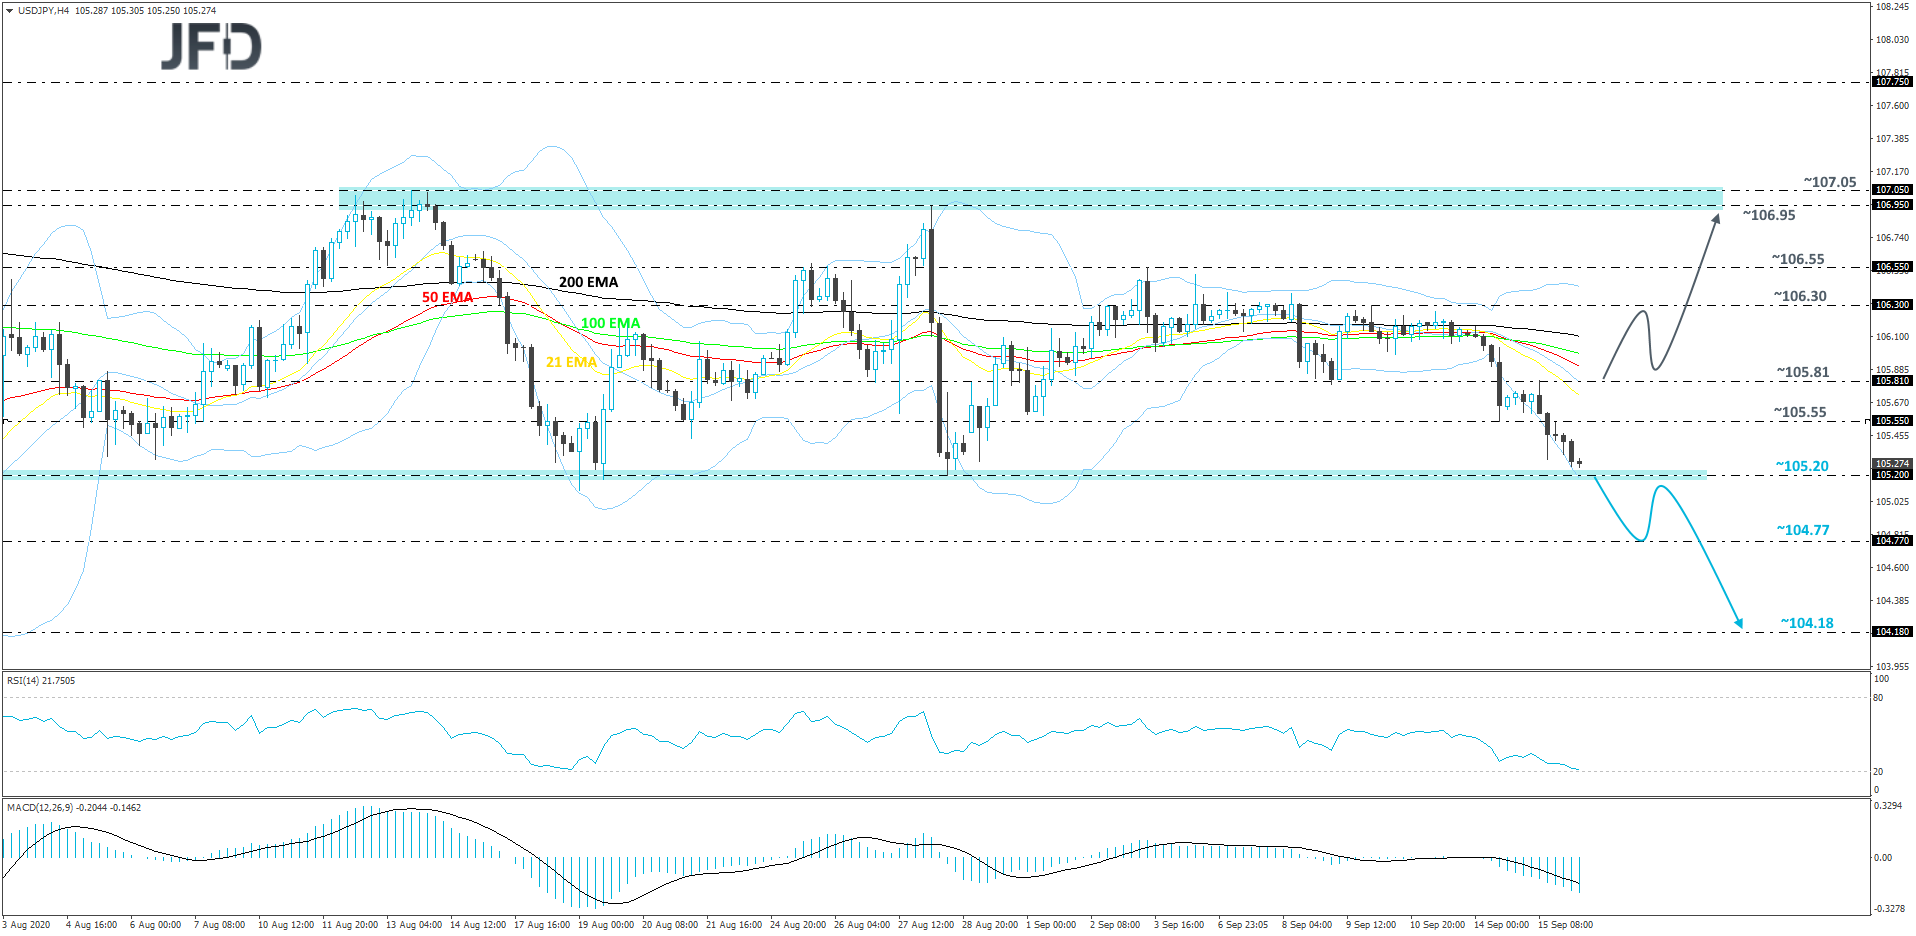
NASDAQ 100 Technical Outlook
After a recent decline and then finding support near the 10938 hurdle, Nasdaq 100 started shifting back up again. Although it is currently trading above a short-term tentative upside support line taken from the low of September 11th, the index is still balancing below one of its key resistance areas between the 11568 and 11585 levels, marked by the highs of September 10th and 8th respectively.
In order to aim for higher areas, we would prefer to see a break of the above-mentioned resistance area first, hence why we will stay cautiously bullish, at least for now.
If the price does rise above the previously-mentioned 11585 barrier, that would confirm a forthcoming higher high, potentially opening the door to the 11753 hurdle, or to the 11845 area, marked by the high of September 4th. Nasdaq 100 might stall there for a bit, or even correct back down. However, if the index stays above the aforementioned short-term upside support line, the bulls could take advantage of the lower price and push it up again. If so, Nasdaq 100 may rise to the 11845 zone again, a break of which could set the stage for a further move north. That’s when we will target the 11923 obstacle, or the 11990 level, which is the low of August 31st.
Alternatively, if the previously-discussed upside line breaks and the price falls below the 11365 zone, which is the high of September 14th and an intraday swing low of September 15th, that may change the short-term trend and open the way to some lower areas. The index would also be placed below the 200 EMA on the 4-hour chart, what some sellers could see as a positive for them. Nasdaq 100 may then drift to the 11185 obstacle, a break of which might set the stage for a test of the 10938 level, marked near the lows of September 8th and 11th.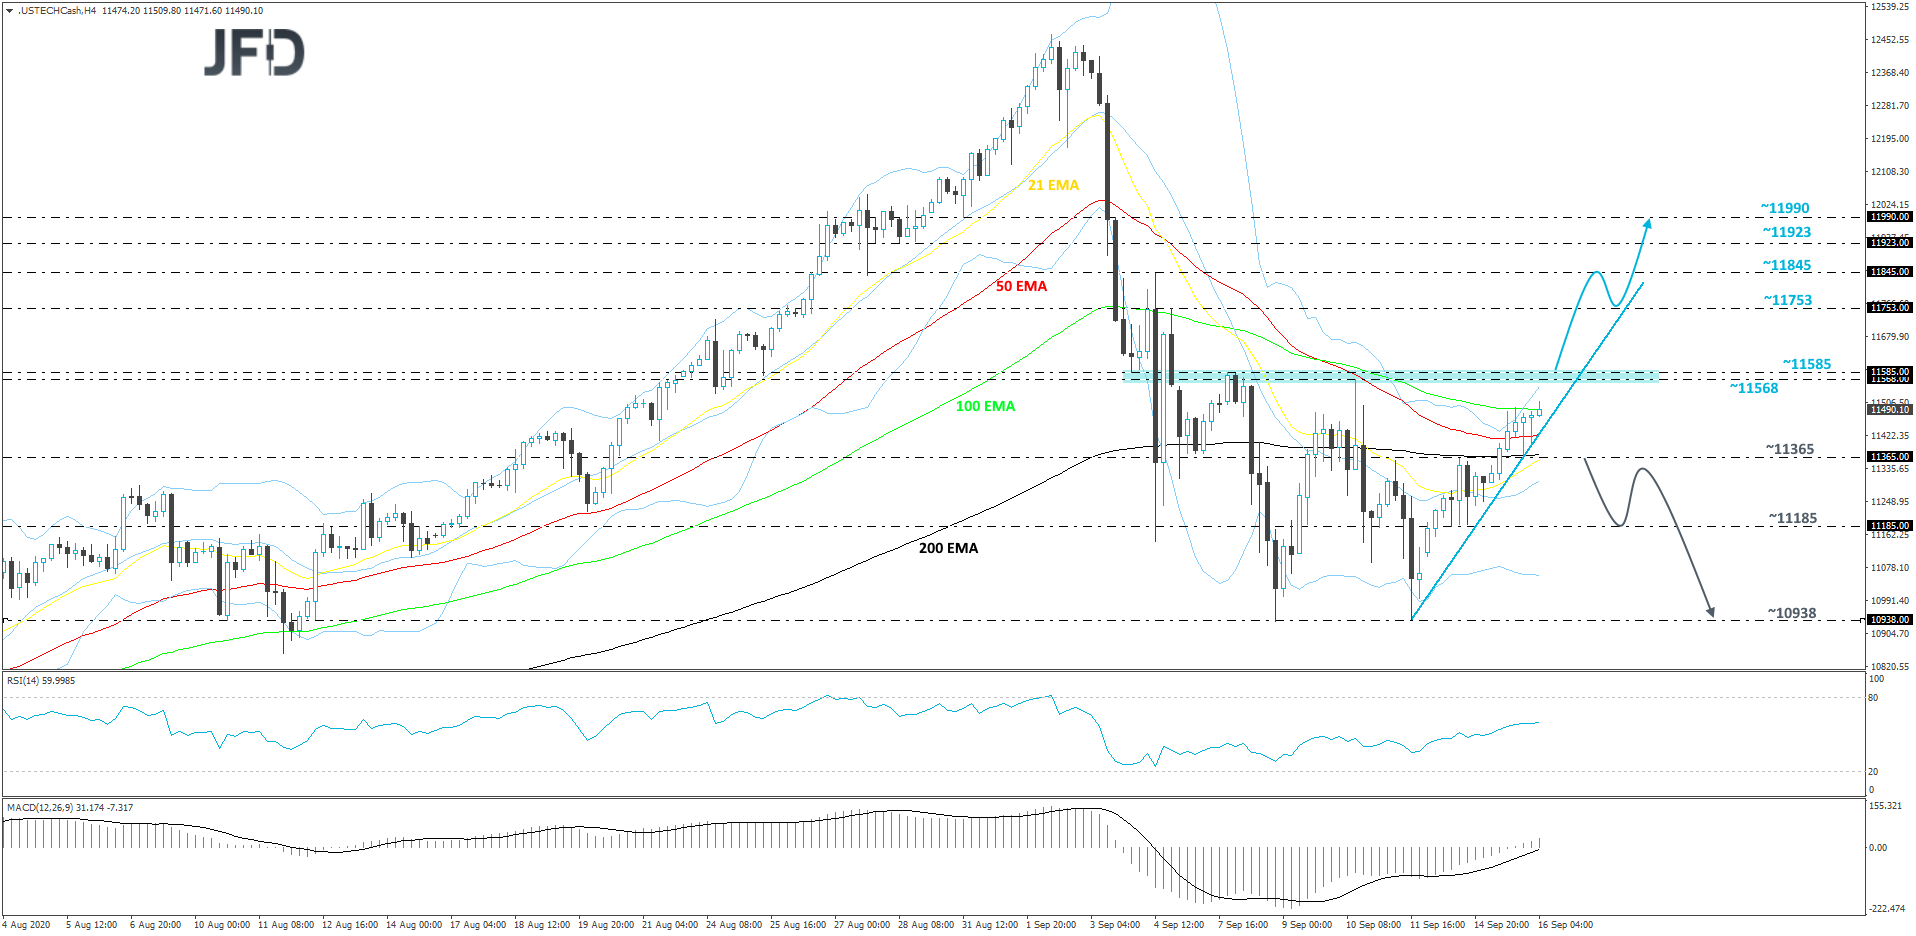
As For The Rest Of Today's Events
During the EU session, we have the UK CPIs for August. Both the headline and core CPI rates are expected to have tumbled to +0.1% yoy and +0.6% yoy from +1.0% and +1.8% respectively.
At the latest BoE gathering, policymakers kept monetary policy unchanged, while in the quarterly Monetary Policy Report, it was noted that officials discussed the effectiveness of negative interest rates and noted that they will continue to monitor their appropriateness.
What’s more, on September 2nd, Governor Bailey said that negative rates are still a tool in in the Bank’s toolbox, although they are not planning to use it at the moment. Ahead of the previous gathering, there was some speculation that the Bank may at some point decide to cut rates sub-zero, and a notable slowdown in inflation may revive such speculation.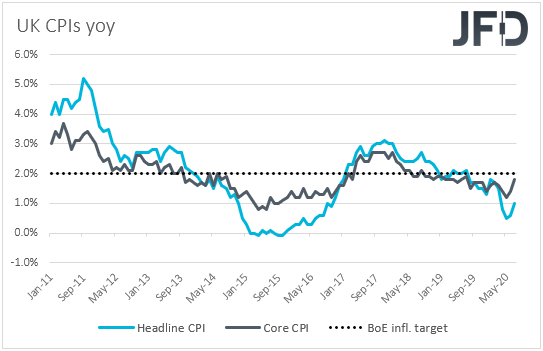
From the US, besides the FOMC decision, we also have retail sales for August, while from Canada, we get the CPIs for the month. Headline sales are expected to have slowed to +1.0% mom from +1.2%, while the core rate is anticipated to have declined to +0.9% mom from +1.9%. With regards to Canada’s inflation, the headline CPI rate is expected to have risen to +0.4% yoy from +0.1%, while no forecast is available for the core rate.
With regards to the energy market, we have the EIA (Energy Information Administration) report on crude oil inventories for last week. The forecast points to a 1.271mn barrels inventory build, following a 2.032mn increase the week before. That said, bearing in mind that, yesterday, the API (American Petroleum Institute) reported a 9.517mn inventory slide, we would consider the risks surrounding the EIA forecast as tilted to the downside.
As for the speakers, besides Fed Chair Powell, who will hold a press conference following the FOMC decision, we will also get to hear from ECB Chief Economist Philip Lane.