AHCA – Fade To Black
One thing you can’t take away from Wall Street is the ability to “spin” a bad news event into a “positive” for the market.
Remember when “A Trump Election Will Crash The Market?”
But on election night, as the impossible became possible, Wall Street’s view was immediately spun into “Trumponomics Is The Revival Of Reaganism.” Of course, this spin has been the fuel for the post-election surge in “infrastructure” related investments.
Over the last three years, as I have repeatedly documented, the “Affordable Care Act” has caused health care premiums to skyrocket which, along with homeowners equivalent rent, has been the primary source of inflationary pressures (read this). Repealing the ACA, along with the underlying taxes and mandates, was a cornerstone of the current administration’s plans and a much-needed source of relief for Americans being impacted by spiraling costs.
However, on Friday, it became clear the ACA replacement, the “American Health Care Act,” did not have the votes to pass and was pulled by Speaker Paul Ryan and tabled. While the “AHCA” plan was really not much better than the “ACA,” it did relieve American’s from the mandate to buy insurance. The death of the AHCA means the ACA remains for now along with the mandate to buy insurance and higher costs.
Immediately Wall Street spun this very negative news into the “positive” as noted by Margaret Patel via Wells Fargo Asset Management:
“It looked like the market was worried that the Trump agenda would get completely bogged down in the healthcare issue, and now that they’ve taken the healthcare issue off the table, I think the market is more optimistic that they can do other things that are more doable that are not so complicated, such as regulatory reform and lowering taxes.”
Here’s the problem for investors and the economy.
“Ignoring the fact that work on tax reform in earnest won’t start for 6-8 weeks as House Ways and Means member Merchant said moments ago, and may not even take place until fiscal 2018 (after August), the reality is that since Obamacare and tax reform are both parts of the Reconciliation process, as a result of not freeing up hundreds of billions from the deficit that the CBO estimated repealing Obamacare would do, it means that Trump’s tax cuts have been hobbled – by as much as $500 billion – before even starting.
Furthermore, with the Freedom Caucus flexing its muscle and openly defying Trump, another major headache for Trump’s tax reform is that the Border Adjustment Tax – an aspect of the reform that the Caucus has been vocally against – is likely off the table. And since BAT was expected to generate over $1 trillion in government revenues, it means that a matched amount in tax cuts is also now off the table.
In summary, between Obamacare repeal and BAT being scrapped, roughly $1.5 trillion in budget “buffers” are wiped out.”
Furthermore, from Axios:
- We now know that Congressional Republicans are willing to buck Trump and leadership on big-ticket legislative items.
- Republicans will need to keep working on healthcare reform, even though Trump says that he’s done with it. They’ve campaigned for years on killing Obamacare, and can’t head into the mid-terms without giving it another go. Particularly when they keep insisting that the current scheme is collapsing?
- CBO said that the Republican healthcare bill would shrink long-term budget deficits by hundreds of billions of dollars. Without it, filling the tax revenue hole becomes harder.
- Sean Spicer today said repeatedly that Trump had talked to “everyone” and listened to “all” ideas, which reflects zero consideration of Congressional Democrats. If such sentiment persists it just raises the degree of difficulty for tax reform, particularly if the White House doesn’t change its position on keeping corporate tax reform tied to personal tax reform.
With the government currently at the “debt ceiling limit,” and the June 1st deadline approaching for “extraordinary funding measures,” Congress will need to address the FY18 budget resolution before it can act on tax reform. This is necessary to provide the “reconciliation instructions” that allow Republicans to pass tax legislation with only 51 votes in the Senate (and therefore no Democratic support). Reaching an agreement on the FY budget resolution will not be easy; in the past, conservatives have demanded a balanced budget within ten years but this would require endorsing spending cuts (in non-binding form) that some centrist Republicans might oppose along with the BAT.
Given this backdrop, tax reform will probably not begin to move through the legislative process until after June at the earliest. Of course, while Wall Street believes “tax reform” will be a much easier process than repealing health care, the reality is it could be just as tough as government entitlement programs, funding for Planned Parenthood, and other programs central to the Democrats, and some left-leaning Republicans, come under attack.
For the markets, which have ramped up since the election on “hopes” of a quick implementation of reforms under the new Administration, the risk of disappointment is running high. Or, as Jerry Reed once sang in “East Bound and Down:”
“We got a long way to go and short time to get there.”
Earnings – A Lot Less Than Meets The Eye
Here’s a problem.
With roughly all of the S&P 500 having reported Q4-earnings, a problem has emerged.
Despite the exuberance from the media over the “number of companies that beat estimates” during the most recent reported period, 12-month reported earnings per share are roughly at the same level as they were at the end of 2013. This has occurred during the same period the companies that report those earnings have risen in aggregate from 1848 to 2238, or an increase of 21.13%.
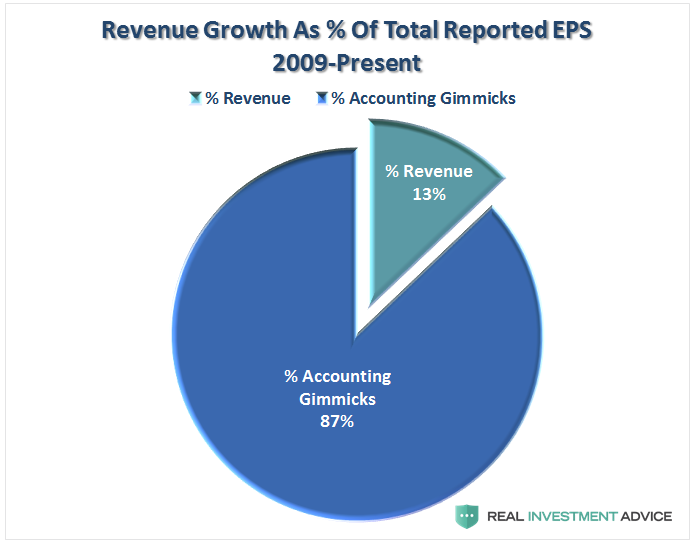
While operating earnings are the primary focus of analysts, the media, and hucksters, there are many problems with the way in which these earnings are derived due to one-time charges, inclusion/exclusion of material events, and outright manipulation to “beat earnings.” This problem has been exacerbated since the end of the financial crisis, as we will discuss more in a moment, to the point to where only 13% of total revenue growth is coming from actual revenue, the rest is from accounting gimmickry, buybacks, and outright fudging.
From a historical valuation perspective, reported earnings are the ONLY METRIC relevant in determining market over/undervaluation levels. It is from this perspective the news deteriorated further as 12-month reported earnings per share in 2013 was $100.20/share versus just $94.54 at the end of 2016. Again, while asset prices have risen by 21%, reported earnings fell by -5.65% However, despite the improvement in reported earnings for 2016, the trend remains clearly negative.
Remember:
“Price is what you pay. Value is what you get.” – Warren Buffett
Always Optimistic
There is one commodity that Wall Street always has in abundance, “optimism.” When it comes to earnings expectations, estimates are always higher regardless of the trends of economic data. The problem is that the difference between expectations and reality have been quite dramatic.
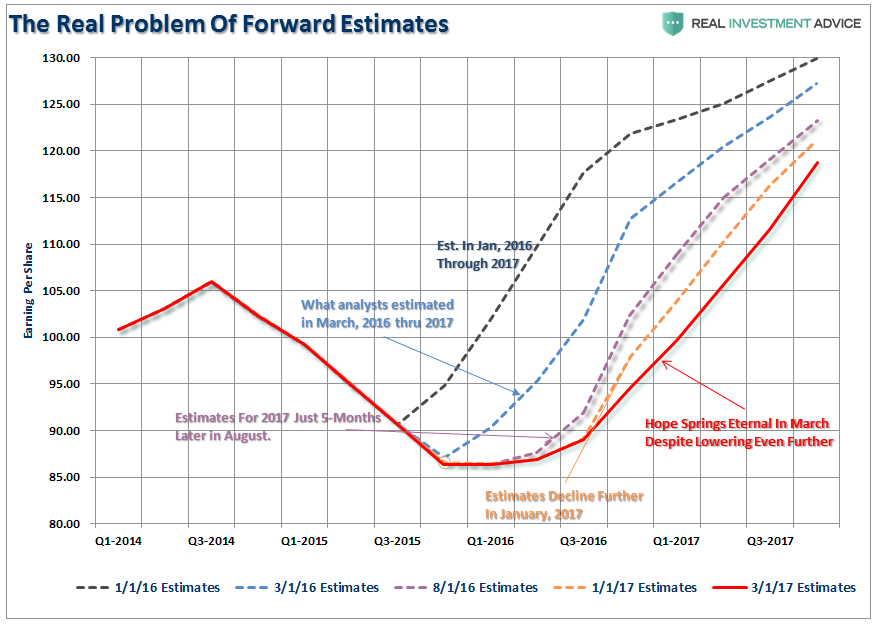
The chart below shows the shift of forward estimates from January, 2016 for the end of 2017. I have included estimate updates for March and August of 2016 as well as January and March of 2017. The problem is that IF you bought stocks in January 2016 based on a valuation assumption of forward estimates, you now own a much more expensive investment.
The game is simple:
“Lower the earnings bar until companies can beat earnings to justify the ‘buy’ the bullish meme.”
Notice in the chart above, in just the last month forward earnings expectations have been lowered further for this year and we aren’t even out of the first quarter yet. This downward slide of earnings expectations for this year is shown more clearly below.
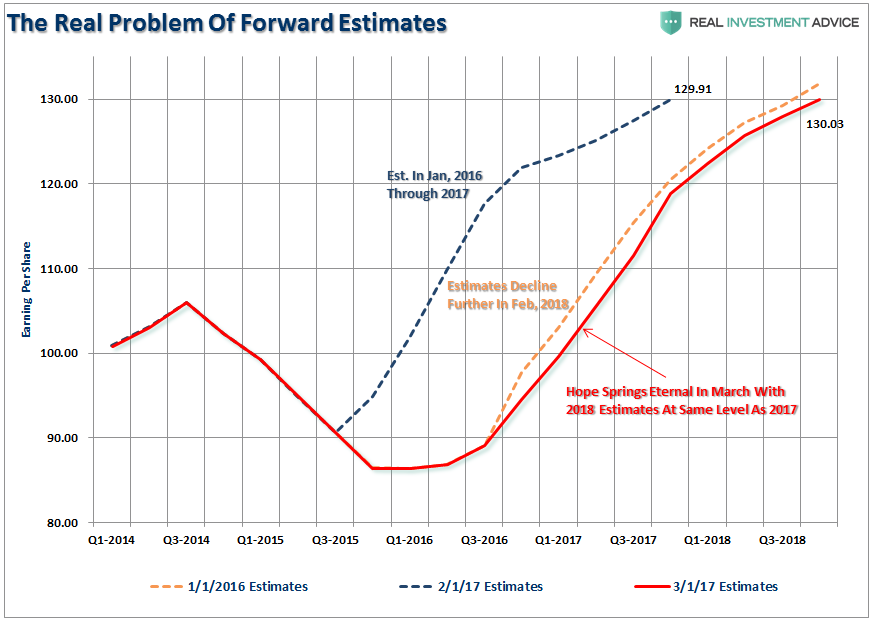
Importantly, notice that estimates through 2018 are at the same level as they were in 2016.
Here is the issue. IF analysts are right this time, and they never are, and earnings do rise to $130/share in 2018, which is based on tax reform and infrastructure spending hopes, earnings will be at the same level as they were projected to be at the end of 2017 at the beginning of 2016.
Yet, at the same time, investors have continued to push asset prices higher.
Do you see the problem here?
Of course, the reality is that since forward earnings are always over-estimated by roughly 30%, and eventually revised down so companies can win the “Beat the Number” game, the market is currently even more expensive than investors realize.
Don’t believe me.
Here is the clearest way to show the forward estimate problem. Let’s take a look at where earnings estimates started in 2016 and assume we hold the analysts responsible for their calls. Here is what the progression looks like.
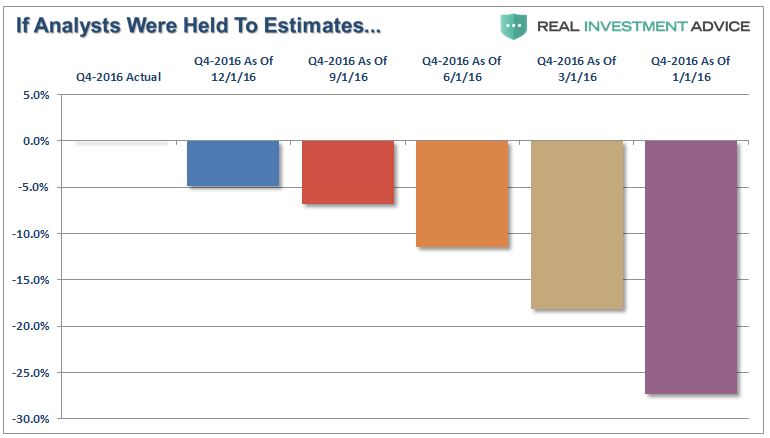
Estimates in 2016 were nearly 30% off the mark. Yet during that time, investors ran stocks higher (capital appreciation only) by nearly 10%.
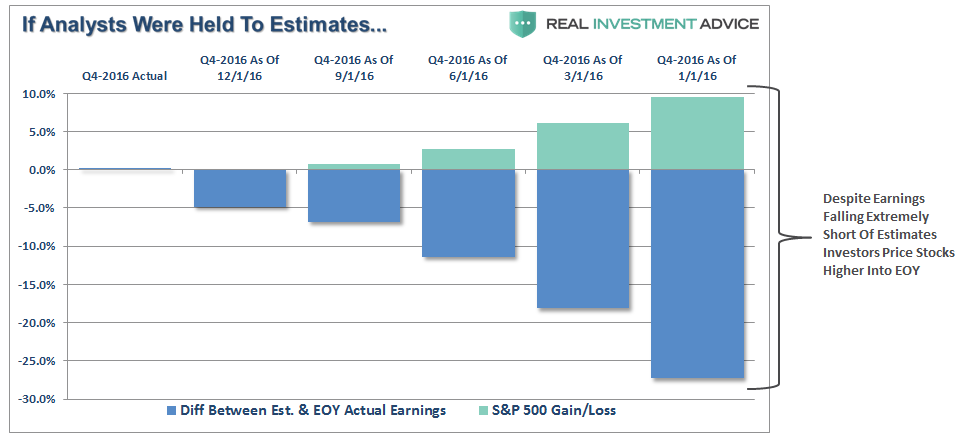
Again, are you seeing the problem?
Earnings Manipulation Reaching Limits
There is no arguing corporate profitability improved during 2016 as oil prices recovered. The recovery in oil prices specifically helped sectors tied to the commodity such as Energy, Basic Materials, and Industrials. However, such a recovery may be fleeting as the dollar remains persistently strong which continues to weigh on exports and the recovery in commodity prices continues to remain muted as the global economy remains weak.
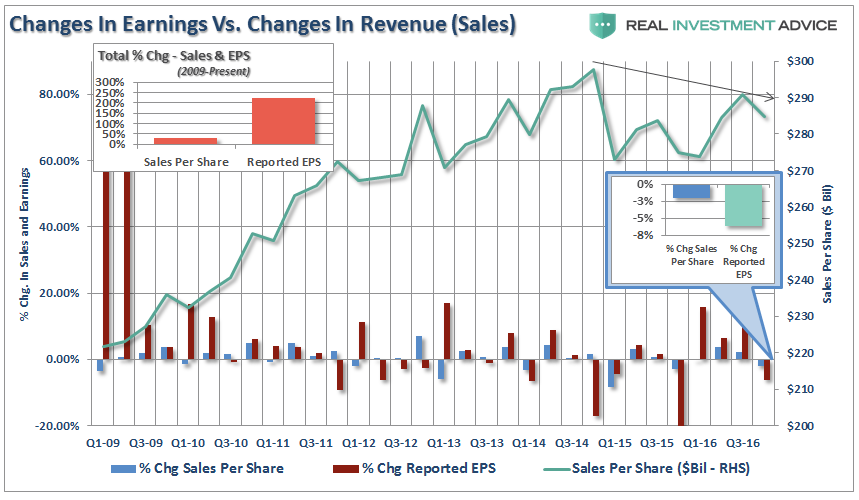
However, looking back it is interesting to see that much of the rise in “profitability” since the recessionary lows has come from a variety of cost-cutting measures and accounting gimmicks rather than actual increases in top line revenue. As shown in the chart below, there has been a stunning surge in corporate profitability despite a lack of revenue growth.
Since 2009, the reported earnings per share of corporations has increased by a total of 221%. This is the sharpest post-recession rise in reported EPS in history. However, that sharp increase in earnings did not come from revenue which is reported at the top line of the income statement. Revenue from sales of goods and services has only increased by a marginal 28% during the same period.
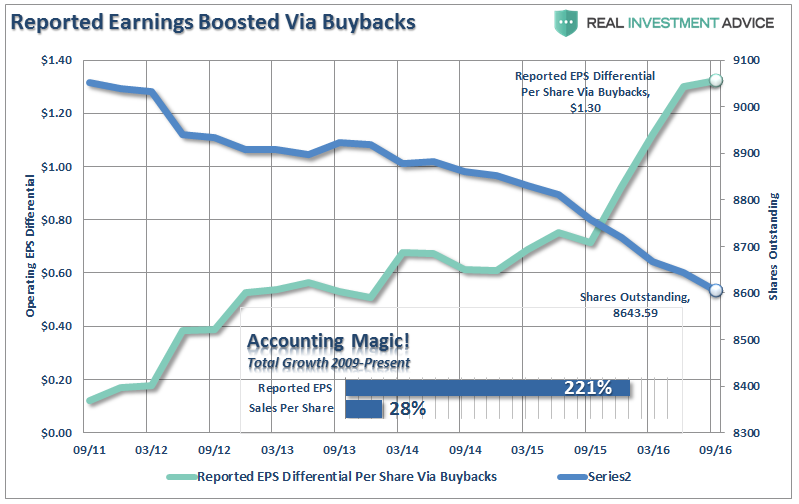
In order for profitability to surge, despite rather weak revenue growth, corporations have resorted to four primary weapons: wage reduction, productivity increases, labor suppression and stock buybacks. The problem is that each of these tools creates a mirage of corporate profitability which masks the real underlying weakness of the overall economic environment. Furthermore, each of the tools used to boost EPS suffer from both being finite in nature and having diminishing rates of return over time.
The chart below shows the total number of outstanding shares as compared to the difference between operating earnings on a per/share basis before and after buybacks.
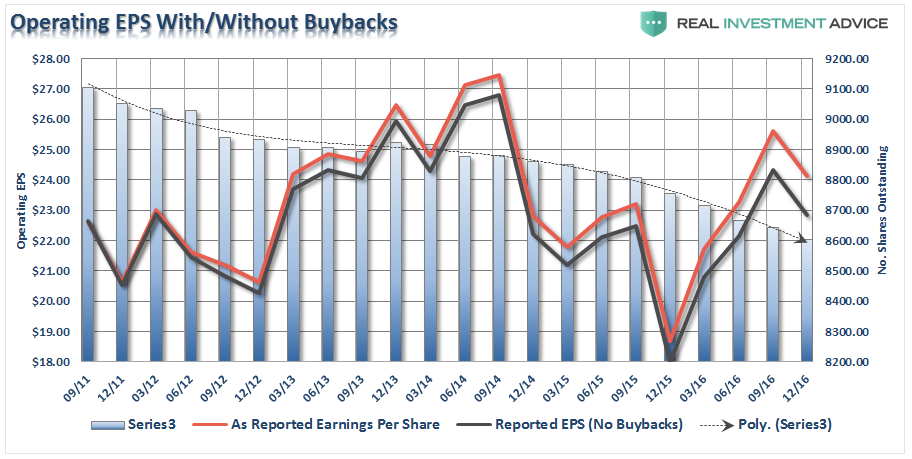
The reality is that stock buybacks create an illusion of profitability. If a company earns $0.90 per share and has one million shares outstanding – reducing those shares to 900,000 will increase earnings per share to $1.00. No additional revenue was created, no more product was sold, it is simply accounting magic. Such activities do not spur economic growth or generate real wealth for shareholders. However, it does provide the basis for with which to keep Wall Street satisfied and stock option compensated executives happy.
Ultimately, the problem with cost cutting, wage suppression, labor hoarding and stock buybacks, along with a myriad of accounting gimmicks, is that there is a finite limit to their effectiveness. Eventually, you simply run out of people to fire, costs to cut and the ability to reduce labor costs. The last point is most prevalent as I discussed previously:
“While there are many hopes of an end to the current ‘profits’ recession, there is mounting evidence those hopes may once again be disappointed. One of the latest such indications is rising employee compensation.
While rising employee compensation is good from the view it should lead to rising consumption, it also reduces corporate profitability (wages reduce profits.) Furthermore, this is especially problematic currently as rising compensation is being offset by soaring healthcare costs due to the Affordable Care Act.”
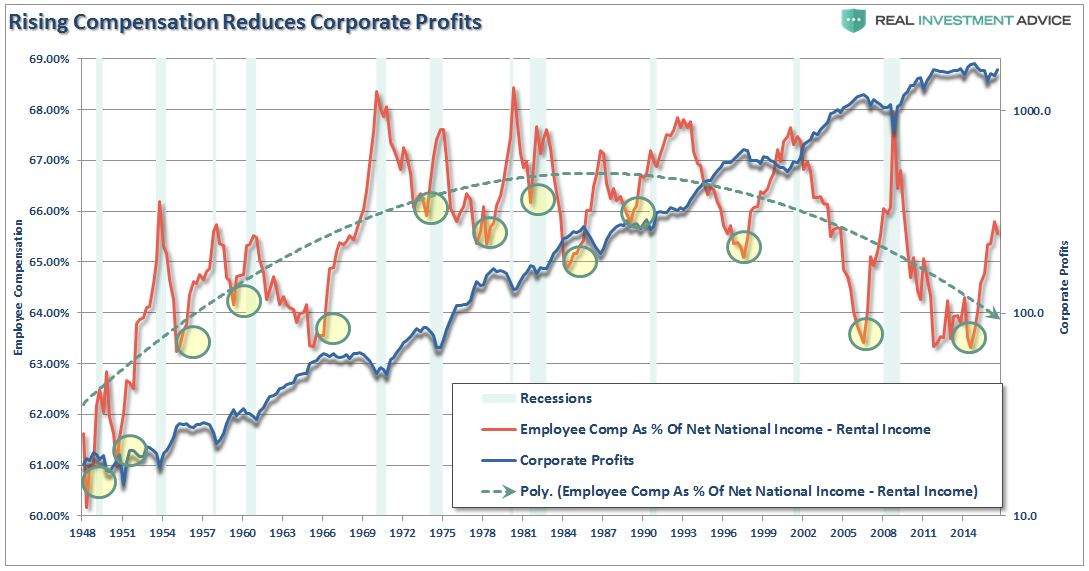
“Like jobless claims, which hit historically low levels prior to recessions (see here), rising employee compensation has also denoted turns in economic growth and has preceded the onset of recessionary economic drags.”
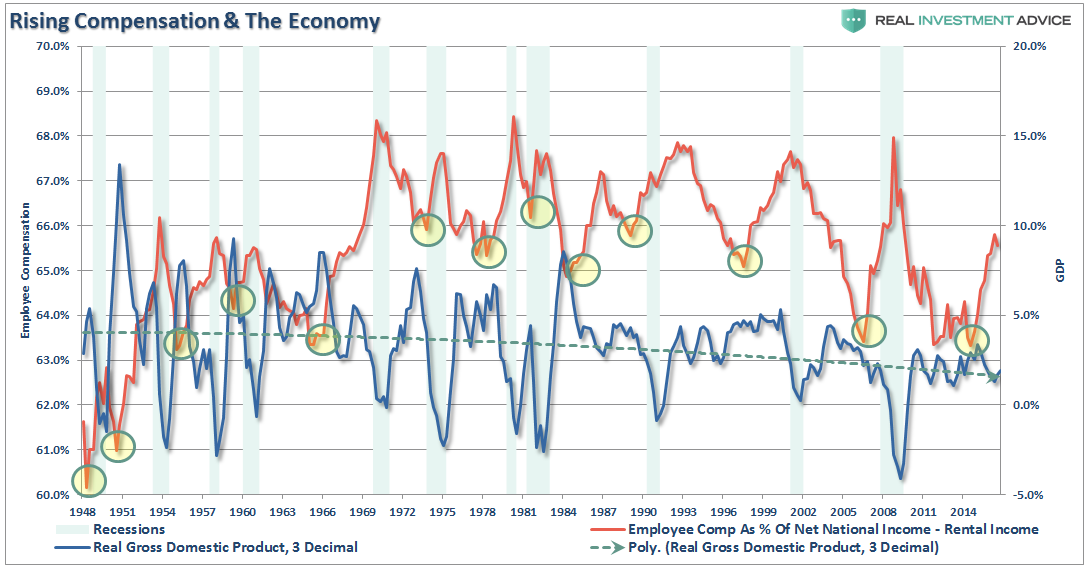
“It is worth noting that in both charts above, despite hopes of continued economic expansion, both employee compensation, and economic growth have continued to trend to lower since the 1980’s. This declining growth trend has been compensated for by soaring levels of debt to sustain the current standard of living.”
There is virtually no “bullish” argument that will currently withstand real scrutiny. Yield analysis is flawed because of the artificial interest rate suppression. It is the same for equity risk premium analysis. Valuations are not cheap, and increases in interest rates by the Fed will only act as a further brake on economic growth.
However, because optimistic analysis supports our underlying psychological “greed”, all real scrutiny to the contrary tends to be dismissed. Unfortunately, it is this “willful blindness” that eventually leads to a dislocation in the markets.
This is not a market to overly complacent in.
Remain long, but remain hedged. The cracks in the facade are becoming more exposed.
Market & Sector Analysis
Data Analysis Of The Market & Sectors For Traders
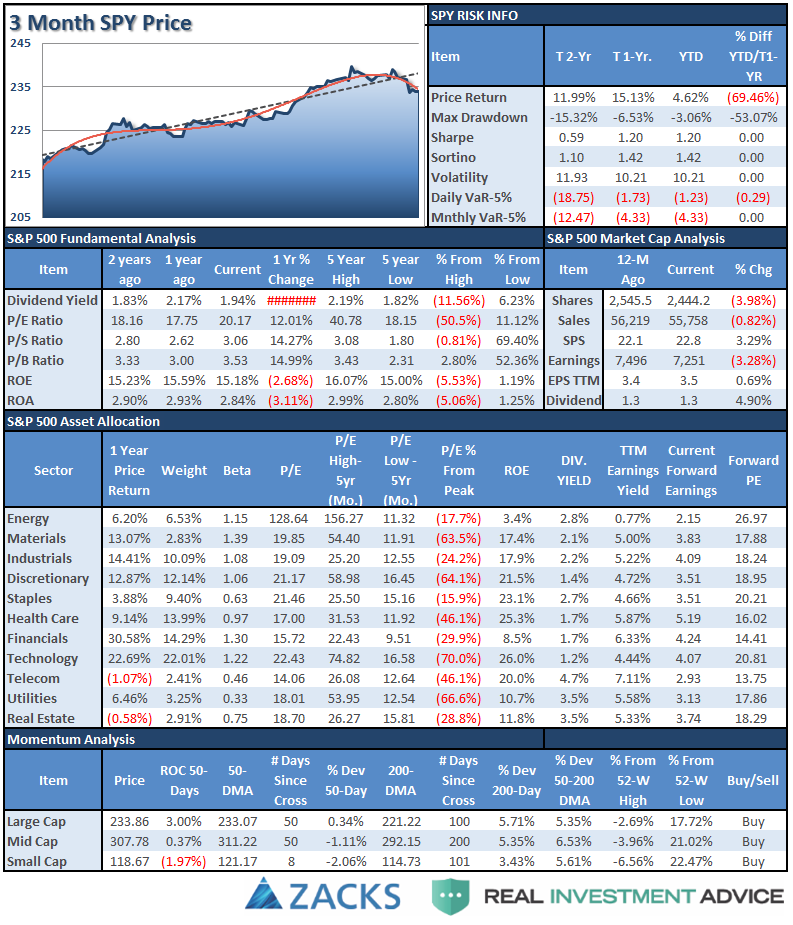
S&P 500 Tear Sheet
The “Tear Sheet” below is a “reference sheet” provide some historical context to markets, sectors, etc. and looking for deviations from historical extremes.
Sector Analysis
Over the last couple of weeks, the market has begun a corrective process. Currently, the market is oversold enough on a daily basis, and holding support at the 50-dma, which suggests a rally attempt is likely next week.
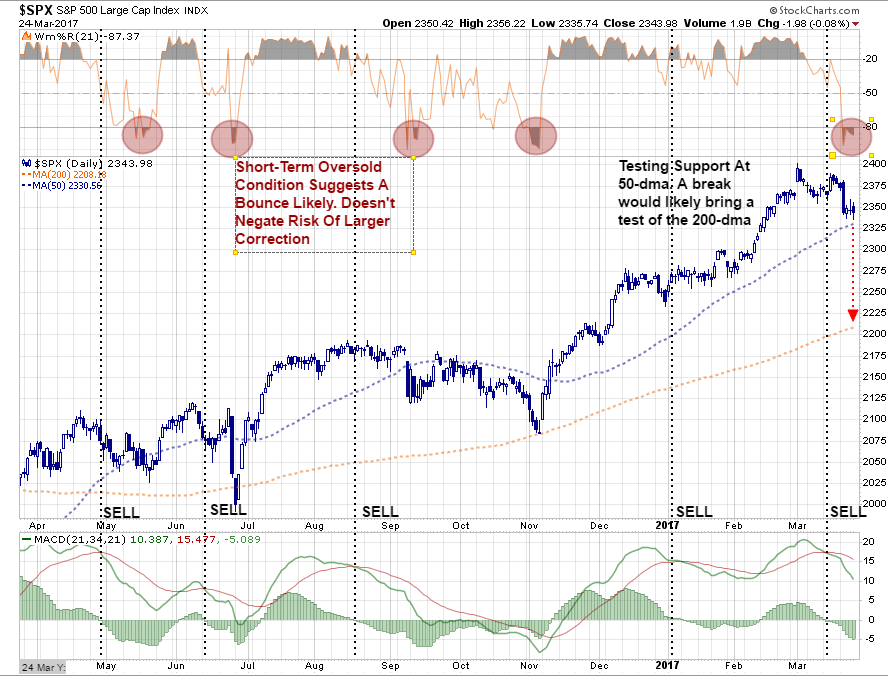
However, any such rally attempt should be faded in the short-term as the market remains on a SELL signal currently, as shown at the bottom of the chart. Previously, when oversold conditions have coincided with a sell-signal, corrections have tended to continue until the 200-dma moving average was tested.
Given the current economic and fiscal policy backdrop, such a retest at this juncture would not be either surprising or unwarranted. Furthermore, such a corrective action would provide the relief necessary to potentially upgrade equity risk exposure in portfolios.
Remain cautious currently as the “risk-off” trade has continued to advance over the last week.
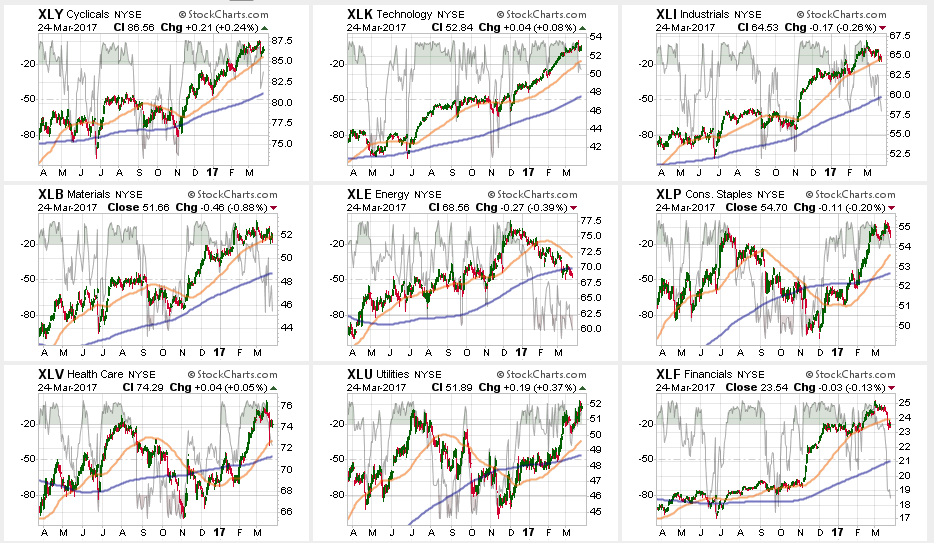
Technology (Technology Select Sector SPDR (NYSE:XLK)), Industrials (Industrial Select Sector SPDR (NYSE:XLI)), Discretionary (Consumer Discretionary Select Sector SPDR (NYSE:XLY)), and Financials (Financial Select Sector SPDR (NYSE:XLF)) lost momentum last week. Continued profit taking in this sector remain prudent due to the extreme overbought conditions present.
Energy (Energy Select Sector SPDR (NYSE:XLE)) continues to struggle after breaking its 50-dma and HAS NOW broken its 200-dma. The big risk right now is a failure of oil prices (West Texas Intermediate Crude) to hold $48/bbl. A failure at that level will likely bring a lot more selling into the commodity putting further downward pressure on the energy sector. Heavily underweight exposure in the sector for the time being and sell-off weak positions that have performed poorly relative to the sector as a whole. The next leg down in energy and commodity prices is on the horizon which will likely coincide with a recessionary onset.
Utilities (Utilities Select Sector SPDR (NYSE:XLU)), Healthcare (Health Care Select Sector SPDR (NYSE:XLV)), and Staples (Consumer Staples Select Sector SPDR (NYSE:XLP)) just had their respective 50-dma cross back above the 200-dma suggesting a much better buying opportunity on sector pullbacks in the future. We will be looking to add to our current holdings on such an opportunity. In the short-term, take profits and rebalance weightings in portfolios after the recent advance as they are a bit ahead of themselves currently.
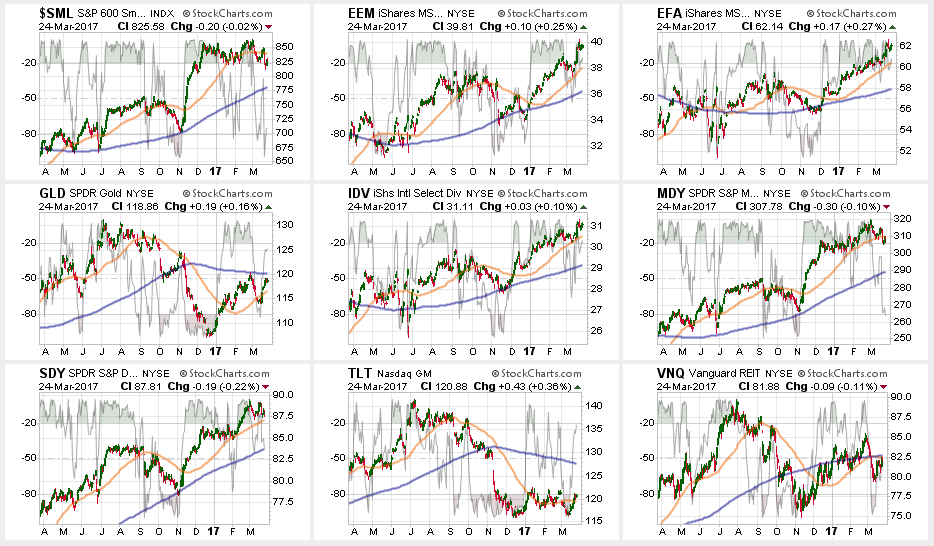
Small and Mid-Cap stocks continued to weaken in terms of relative performance and have broken their 50-dma. While they may get a bounce next week, a failure to recover their relative strength will suggest further weakness. Take profits and rebalance to portfolio weightings.
Emerging Markets, International, and Dividend Yield Stocks are again very overbought. The bull trend is still intact but some profit taking and rebalancing is advised.
Bonds and REIT’s got oversold last week and performance improved this past week. If the broad markets run into further trouble look for a continued rotation in the “safety trade.”
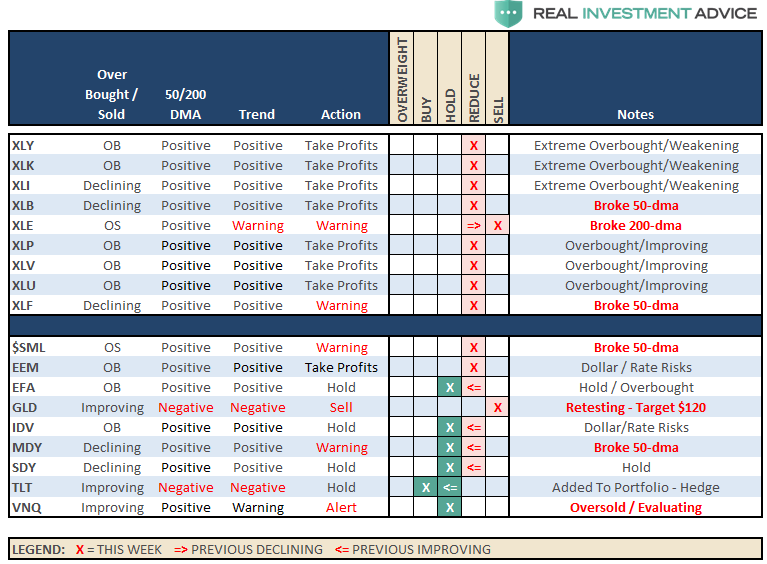
Overbought conditions exist almost unilaterally across the entire complex suggesting a higher risk/reward condition currently until a correction occurs. Due to this condition, we did rebalance portfolio weightings a month ago to raise some cash. As noted, we are not adding any new equity exposure currently for this reason. We are, however, actively buying individual bonds for portfolios.
The table below shows thoughts on specific actions related to the current market environment.
(These are not recommendations or solicitations to take any action. This is for informational purposes only related to market extremes and contrarian positioning within portfolios. Use at your own risk and peril.)
Portfolio Update:
After hedging our long-equity positions 14-weeks ago with deeply out-of-favor sectors of the market (Bonds, REIT’s, Staples, Utilities, Health Care and Staples) we did rebalance some of our long-term CORE equity holdings back to original portfolio weightings harvesting a bit of liquidity.
The short-term bullish trend is still very positive which keeps us allocated on the long-side of the market. HOWEVER, the technical setup required for an increase in equity risk in portfolios currently is NOT FAVORABLE currently.
We continue to maintain very tight trailing stops as the mid to longer-term dynamics of the market continue to remain very unfavorable as well.
Rebalancing remains strongly advised.
