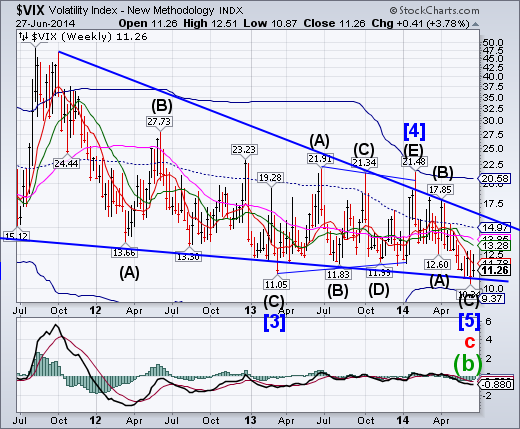
The Volatility S&P 500 traded in a range above its Ending Diagonal trendline, closing with a weekly gain. While the “old VIX”(VXO) plunged to a record low this week, the VIX was not perturbed.
SPX closes beneath the Diagonal trendline
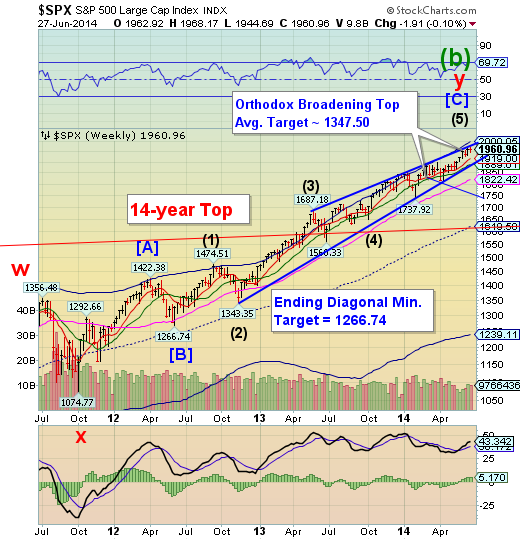
S&P 500 made a new high on Tuesday, but stayed inside its Ending Diagonal formation.Tuesday was the last day in which SPX could make a new high within the current Master Cycle and it took advantage of it.The last few days of the quarter are usually good performers, due to quarter-end window dressing. There is little evidence of that in the past week The Cyclical Model indicates a potential strong decline ahead.
ZeroHedge: Despite exuberant Services and Manufacturing PMIs,Bloomberg's index of CEO sentiment remains stagnant near 2014 lows as April's hope for Q2 has faded into 'more of the same' by June. As Bloomberg's Rich Yamarone points out, in reality (in spite of all the hope), the second quarter is drawing to a close and it was a rough one for corporate America, with CEOs citing "slower growth in household income overall", "the recovery remains fragile, especially for customers on a budget", and perhaps most concerning, "whether or not this softness in store traffic is representative of a permanent sea change in customer behavior or a temporary phenomenon is hard to tell at this stage."
NDX “most shorted” stocks get a boost into the close
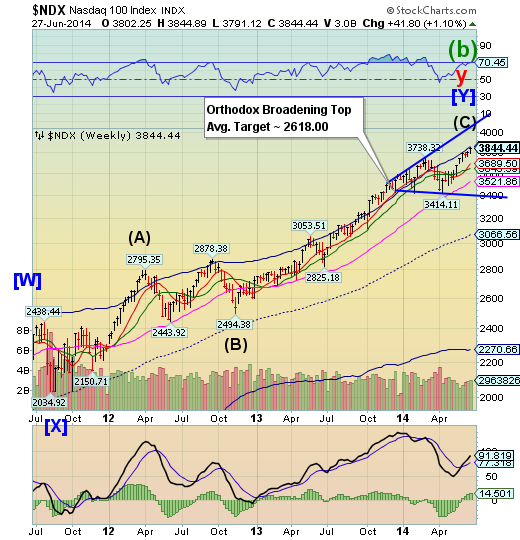
NDX made a new Cycle high just beneath its Cycle Top resistance.It appears to have completed point 5 of its Orthodox Broadening Top formation, and now must complete the Cycle by declining into its Primary Cycle low by mid-July. Primary Cycles may be very strong and are often described in superlatives.
ZeroHedge: Before 330ET, the Nasdaq was the lone survivor in the green this week despite every effort to spark short squeezes and ramps day after day - but that all changed as the ubiquitous late-Friday buying panic occurred of course - lifting stock green for the day (and desperately searching for green on the week). There was a sudden heavy volume dump at 1315ET with no news catalyst making many wonder if a dark pool puked its orders? A glance at the week's market moves would suggest 'volatility' is anything but low - yet we always manage to close day-to-day calmly. Wondering what provides the ammo for Nasdaq's rise?"Most shorted" stocks are up for the 7th week in a row
The Euro lingers beneath Long-term resistance
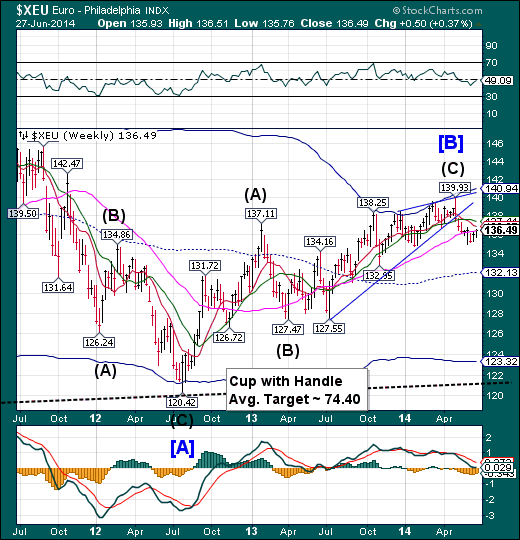
The euro continues to linger beneath its Long-term support/resistance at 136.50, despite multiple attempts to overcome it. Friday was a Pivot day, suggesting the decline may resume on Monday.The next level of support is the weekly mid-Cycle support at 132.13.SinceEndingDiagonals are usually fully retraced, we may expect a high probability of testing its weekly Cycle Bottom at 123.32 or the Lip of the Cup with Handle formation at 121.50.
WSJ: The European Central Bank's new measures to boost growth and the inflation rate across the euro zone seem to have inspired little fresh optimism among businesses and households about the single-currency area's economic prospects.
A European Commission survey released Friday recorded a decline in confidence during June.
The ECB announced a package of measures on June 5 designed to stave off the threat of dangerously low inflation in Europe, including cutting a key interest rate below zero for the first time to get banks to lend more to credit-starved customers.
EuroStoxx reverses
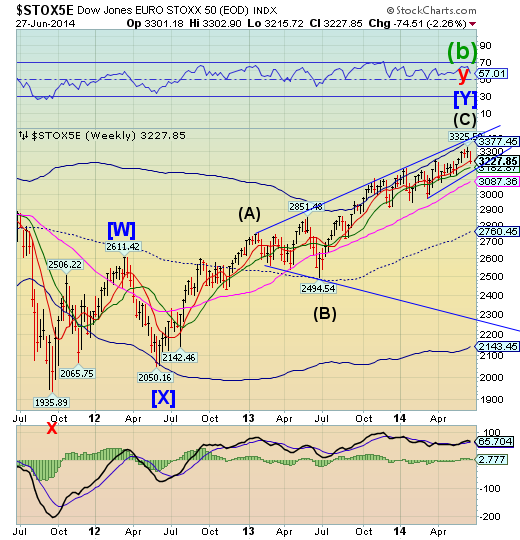
The EURO STOXX 50 (FSTX) reversed down, closing beneath weekly Short-term support/resistance at 3232.21.The reversal may turn into a full-fledged decline with a potential /cycle low on July 14.
ZeroHedge: As the war of words between Europe and Russia has escalated, one of the outcomes that has emerged is that just like in false flag war over Syria, the Ukraine war was about the simplest possible thing, and yet so very complicate: a gas pipeline. Of course, it was never a secret that the prize in controlling Ukraine was possession of the vast pipeline infrastructure that left Russia and entered Europe, but since it was all Gazprom's gas in the first place, it didn't really matter if Kiev had possession of the gas as it transits to Europe, or if, as the case is now, Ukraine is merely a transit hub with all Russian gas delivered to European countries and none of it staying in the civil war torn country. After all as of this moment Ukraine can't afford any Russian gas, and if it siphons off any of the product destined for Germany and beyond it would simply antagonize its new NATO best friends, who also happen to be Gazprom clients.
The Yen ready to break out of its sideways consolidation
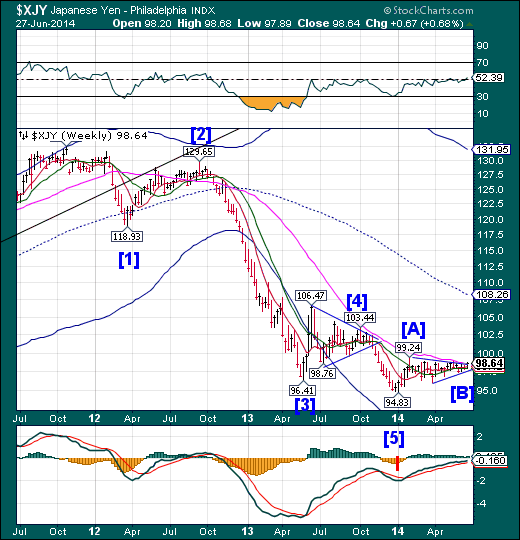
The Yen has completed its Triangle formation and has broken above the Triangle and Long-term resistance at 98.12. Triangles often act as a springboard from which an index may make a very strong, but terminal move. In this case, the intended target may be mid-Cycle resistance at 108.26.
ZeroHedge: With USD/JPY near 4-week lows and, as BofAML'sMacneil Curry warns "is setting up for a breakdown", we thought a look back at the total and utter chaos that last week's FOMC statement (and press conference) unleashed in futures markets. JPY futures were the only market in the world that was halted as the statement was revealed as Nanex shows below it seemed 'someone' decided that 'carry traders' needed to show the world just how positive what Janet said was, then within 24 hours, chaos was unleashed as the real world algos tried to come to terms with just what the Fed had done. With every asset class in the world predicated on JPY weakness, this market behavior shows just how illiquid and thin the world's risk really is.
The Nikkei reverses
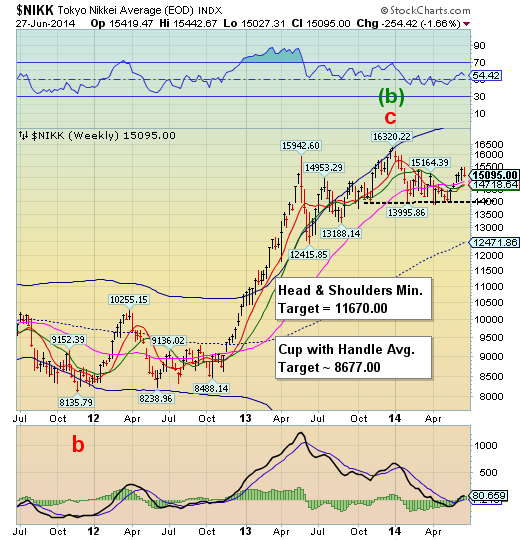
The Nikkei 225 reversed this week after completing the final leg of a flat correction.Last week I suggested that the Nikkei…”completed an inverted Master Cycle high on Friday, which may lead to a strong decline that may start without warning. Next week’s action may give us some answers.” This is what I have been looking for.
(nvesting.com: The Nikkei made a bearish reversal Thursday from its new 6-month highs. We also saw a bearish price reversal in USD/JPY. NIKKEI has finished 5 waves up from its lows from mid-April. In the chart below you can see the 5 wave upward move in NIKKEI from justunder 13900 to 15500. I at least expect a downward correction toward the 50% or 61.8% Fibonacci retracement of this upward move.
his time the risk off signals from USD/JPY coincide with a bearish pattern in NIKKEI. So my target for the short-term is to fall towards 14600-14450. A reminder for USD/JPY, the important level to watch is 100.70. Breaking below that level will signal risk off for Equities and most probably affect markets across the globe. Breaking below 100.70 could push this FX pair toward 92-94.
U.S. Dollar continues itsconsolidation
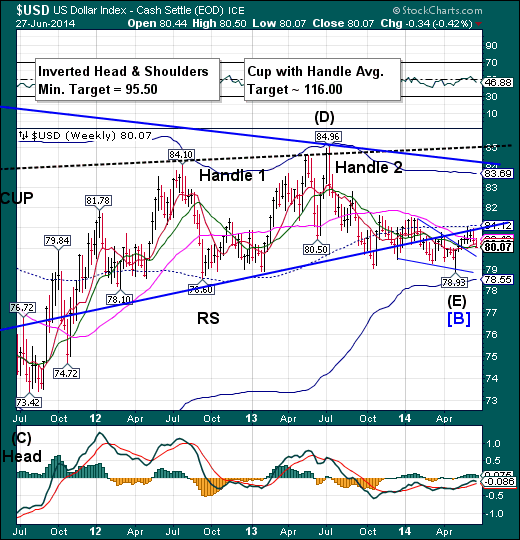
The US Dollar Index closed beneath Intermediate-term support at 80.10.Normally this would be a signal for even deeper lows, but Saturday happens to be a Trading Pivot day.Since the current cycle is right-translated (bullish), the probabilities are high that we may see a breakout rally next week..
Reuters: The U.S. dollar edged lower on Friday against a basket of major currencies and looked set for a second week of losses after positive data on consumer sentiment failed to boost expectations for a rise in interest rates any time soon.
The Thomson Reuters/University of Michigan's final June reading on the overall index on consumer sentiment came in at 82.5, up from 81.9 the month before and above the median forecast of 82.0 among economists polled by Reuters.
Analysts said the upbeat consumer sentiment data left traders cold since it failed to dispel worries about the U.S. economy after data on Thursday showed slightly weaker-than-expected data on consumer spending in May and weekly jobless claims.
Treasuries in a turn window at Short-term resistance
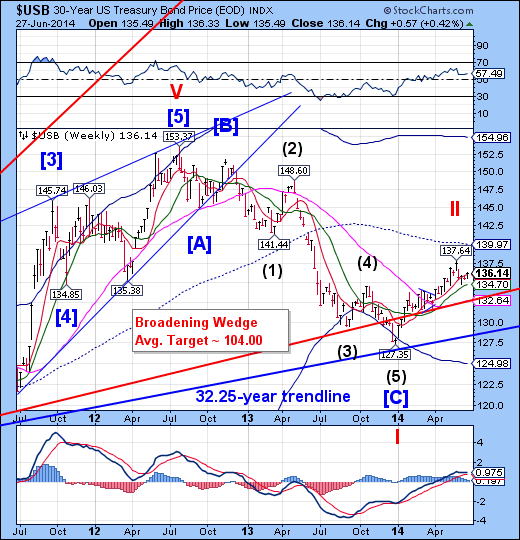
The Long Bond challenged Short-term resistance at 136.02 and closed above it.However, Saturday also happens to be a Pivot day for USB which is also a short-term pivot for a left-translated Cycle, which is bearish.USB now has a date with a major Cycle bottom no sooner than mid-August.
ZeroHedge: As Barclays' Joe Abate warns, delivery fails in the Treasury market have surged recently. While not at the scale of the 2008 crisis yet, we suspect the spike is what is panicking the Fed to say "the market is wrong", talk up short-end rates, and implore the public to sell-sell-sell their bonds. The Fed's market domination has meant massive collateral shortages (as we have detailed previously) and now more even that during last year's taper-tantrum, the repo market is trouble.
The fails are greater than during last year's taper tantrum.
Gold rally is short of its target
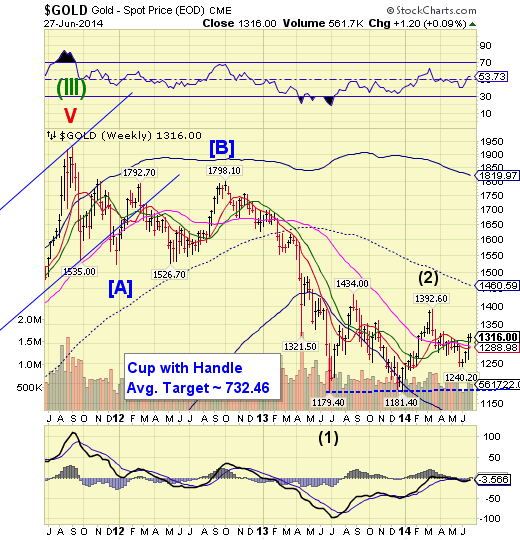
Gold extended its bounce, but fell short of its target of 1131.40 for a second week.It has a combined Primary Cycle and Trading Cycle Pivot on Monday, which gives it one last chance to meet or exceed its target before a reversal.Last week I had suggested that, “The bounce may fail on average about three weeks from the low.”The high occurred on Tuesday, exactly three weeks from the June 3 low. The chance of a new high on Monday is much diminished, contrary to the conclusion of the article below.
ZeroHedge: As the probe into alleged fraud at Qingdao continues to escalate (with liquidity needs growing more and more evident as Chinese money-market rates surge), Bloomberg reports that China’s chief auditor discovered 94.4 billion yuan ($15.2 billion) of loans backed by falsified gold transactions, in "the first official confirmation of what many people have suspected for a long time - that gold is widely used in Chinese commodity financing deals." As much as 1,000 tons of gold may have been used in lending and leasing deals in China and Goldman reports that up to $80 billion false-loans may involve gold. As one analyst noted, this was unlikely to have a significant impact on the underlying demand for gold in China and as we have pointed out before, any unwind of the Gold CFDs would lead to buying back of 'paper' gold hedges and implicitly a rise in prices.
Crude reverses from its Cycle Top
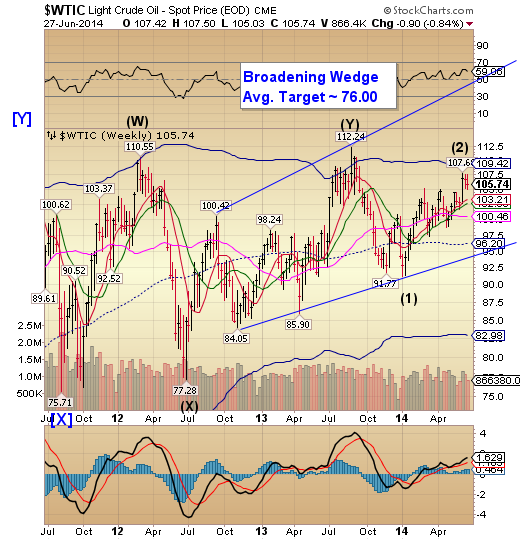
Crude Oil has made a reversal pattern from its Primary Cycle high on Friday, June 13.This week it may have begun its decline in earnest.If correct, we may see a decline into mid-July.We await further developments.
Forbes: We’ve the news that the US is to allow some crude oil exports for the first time since the ban on them was set in place in the 1970s. This is good news as it removes an economic inefficiency (and removing economic inefficiencies is always good news) but it’s not going to make all that much difference to the nation as a whole. It’s really all a fight between the independent crude producers and the independent refiners. They, obviously, care about how this goes, crude exports or no crude exports, but it makes very little difference to the rest of us.
China testing Intermediate-term resistance
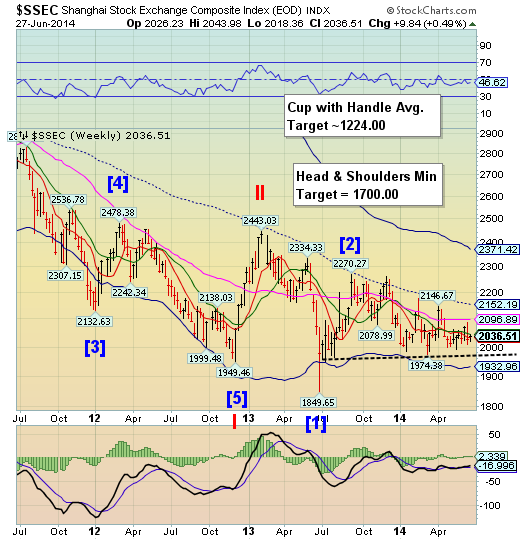
The Shanghai Composite declined beneath all its Model supports after making a Trading Cycle high last week, closed beneath Intermediate-term resistance at 2044.81. It may now resume its descenttoward the neckline of its Head & Shoulders formation. There is no support beneath its Cycle Bottom at 1932.96.
ZeroHedge: While news of high-ranking financial executive suicides in the west have become week to week news, the troubling trend has spread to Asia. A string of Chinese officials have killed themselves in recent months, with speculation linking many to a crackdown on graft. However, as SCMP reports, this weekend saw the head of China's largest copper producer 'fell to this death' from a hotel owned by his company with a state-run newspaper claiming the 52-year-old committed suicide (due to work pressures) following corruption allegations. The timing of Wei Jianghong, chairman of state-owned Tongling Nonferrous Metals Group, suicide appears catalyzed by the growing anxiety over the widespread implications of China's rehypothecation commodity-finance scandal. That leaves one question - what did he know that markets remain ignorant of for now?.
The Banking Index remains stuck beneath trendline resistance
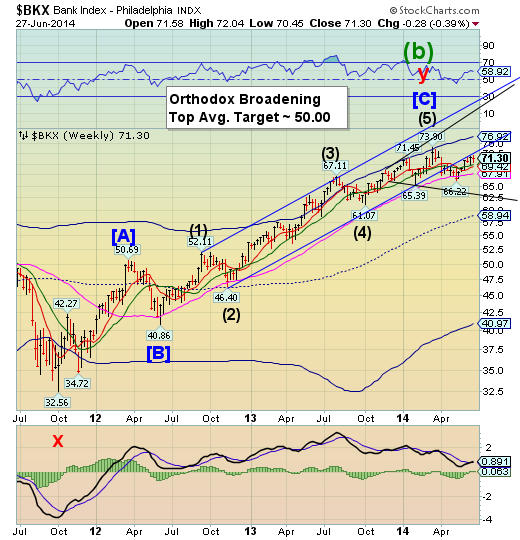
The BKX made a secondary high on Tuesday, but remained beneath the lower trendline of its formerly bullish trading channel. Considering the new highs being made by the SPX and Dow Jones Industrials, this anomaly is a glaring non-confirmation of the other equity indices. A further decline from here may complete its Orthodox Broadening Top formation by breaking the bottom near 62.50.
WSJ: A lawsuit by U.S. authorities accusing Barclays BARC.LN 0.00% PLC of favoring certain stock-trading clients while misleading others hit the bank's shares and raised new questions about its chief executive's efforts to rebuild his institution's bruised image.
New York Attorney General Eric Schneiderman alleged in a Wednesday lawsuit that Barclays favored high-frequency traders in its dark pool, a trading venue in which stock buyers and sellers can operate anonymously, and then lied to clients about those participants' share of trades. Barclays shares fell more than 5% Thursday as investors braced themselves for a potential big fine from the bank's alleged wrongdoing in "dark pool" stock trading.
ZeroHedge: Everyone who has followed this website since 2009 will know that we firmly believe that the "magic plumbing" of the modern financial system is not what is seen on the surface, in terms of declared "on the books" assets and liabilities, but what happens beneath it - in the shadow banking system, a place where trillions in liabilities are created and destroyed via the repo market, to provide short-term funding for all sorts of financial intermediaries, frequently with zero actual exposure in bank Ks and Qs due to regulatory loopholes that allow the "netting" of hundreds of billions of offsetting repo exposure and keeping them off the books, exposure which than can be rehypothecated countless numbers of times. In theory, this works fine. In practice, when a collateral chain is broken and net suddenly becomes gross, you end up with near systemic collapse (especially when the underlying collateral is found to have never existed in the first place - see China).
ZeroHedge: It was a little over a year ago, just as the Cyprus deposit confiscation aka "bail in" was taking place, when we asked, rhetorically, if "Spain is preparing for its own deposit levy" when an announcement by Spain's Finance Minister, Montoro, hinted at the imminent arrival of just that.
Specifically we said:
While Spain's economy minister Luis De Guindos proclaimed in the Senate today that bank deposits under EUR100,000 are "sacred"and that "Spanish savers should stay calm," Spain, it would appear, has changed constitutional rules to enable a so-called 'moderate' levy on deposits - as under previous Spanish law this was prohibited. For now, they claim the 'levy' will be "not much higher than 0%" and is mainly aimed at regions in Spain that have "made no effort to collect taxes" based on new revenue expectations.
Disclaimer: Nothing in this email should be construed as a personal recommendation to buy, hold or sell short any security. The Practical Investor, LLC (TPI) may provide a status report of certain indexes or their proxies using a proprietary model. At no time shall a reader be justified in inferring that personal investment advice is intended. Investing carries certain risks of losses and leveraged products and futures may be especially volatile. Information provided by TPI is expressed in good faith, but is not guaranteed. A perfect market service does not exist. Long-term success in the market demands recognition that error and uncertainty are a part of any effort to assess the probable outcome of any given investment. Please consult your financial advisor to explain all risks before making any investment decision. It is not possible to invest in any index.
