EU and US indices traded north yesterday, perhaps due to Wednesday’s dovish FOMC minutes. That said, the ECB minutes came out yesterday, and they may have caught some investors off guard as they revealed talk of tapering. As for today, Loonie traders may lock their gaze on Canada’s employment report for March, where expectations are for a decent report.
EU And US Shares Gain On Dovish Fed, ECB Minutes Reveal Tapering Talk
The US dollar traded lower against all but two of the other G10 currencies on Thursday and during the Asian morning Friday. It lost the most ground versus SEK, CHF, NZD, and JPY in that order, while it eked out some gains only against GBP. The greenback was found virtually unchanged against NOK.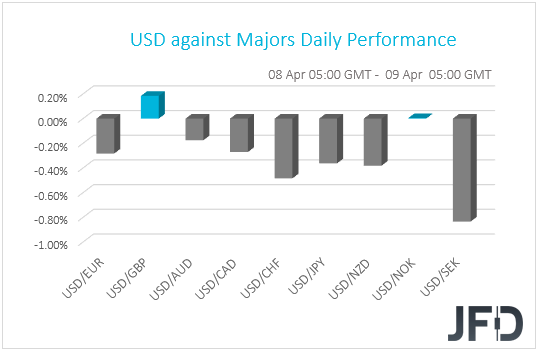
The relative strength of the safe-havens CHF and JPY suggests that markets may have traded in a risk-off fashion. However, the strengthening of the risk-linked Kiwi and the weakening of the US dollar point otherwise. With the performance in the FX world painting a blurry picture with regards to the broader market sentiment, we prefer to turn our gaze to the equity world.
There, major EU and US indices traded in the green, with the S&P 500 hitting a fresh all-time high. The only exception was Italy’s FTSE MIB, which slid 0.66%. Investors’ appetite softened again during the Asian session today, with China’s Shanghai Composite, Hong Kong’s Hang Seng, and South Korea’s KOSPI losing 1.13%, 1.34% and 0.33% respectively, despite Japan’s Nikkei rising 0.27%.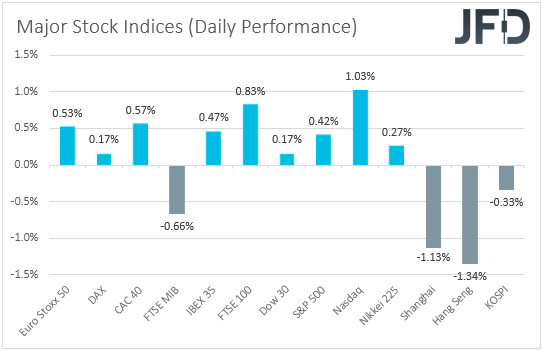
EU and US shares may have continued to gain due to the FOMC minutes revealing on Wednesday that a rise in inflation in the months to come is likely to prove to be temporary and that it is too early to start discussing monetary policy normalization. That view was repeated by Fed Chair Jerome Powell yesterday, when he spoke at an IMF event.
However, market optimism faded relatively quickly, with most major Asian stock indices pulling back. This confirms our view that market participants remain willing increase their risk exposure, but they are also reluctant to drastically do so ahead of next week’s earnings reports.
Yesterday, we also got the minutes from the latest ECB meeting. In contrast with our expectations, the minutes revealed that there was a broad consensus on the understanding that the total PEPP envelope was not called into question in the current conditions and that the pace of purchases could be reduced in the future. Given that at that meeting, they accelerated those purchases due to the “unwarranted” rise in bond yields, we’ve been expecting the Council to stay willing to do more if deemed necessary. Judging by the euro’s reaction to trade higher, it seems that other participants may have had the same opinion.
With the ECB now talking about tapering, we would expect the euro to continue strengthening for a while more, especially against the US dollar, which we expect to continue to weaken due to a Fed not willing to discuss tapering at the moment, and perhaps against the safe-haven yen, which we expect to underperform due to further improvement in the broader market sentiment.
EUR/JPY Technical Outlook
This week, after hitting the area at 130.68, which is slightly above the highest point of March, at 130.66, the EUR/JPY corrected back down and is now trading in the red for the week. The rate may drift a bit more to the downside, but if it stays somewhere above the 100 EMA on our 4-hour chart, there is a chance to rebound, hence, we will take a cautiously-bullish approach for now.
As mentioned above, if the pair drifts a bit lower but gets a hold-up somewhere near the 100 EMA, or the 129.81 hurdle, marked by the low of Apr. 6, that could bring the bulls back into the game, possibly sending the rate higher again. If so, EUR/JPY might travel to the 130.33 hurdle, a break of which may set the stage for a move to the previously-mentioned 130.66 and 130.68 levels, which mark the highest point of March and the current highest point of April respectively.
On the other hand, if the rate continues to drift lower and bypasses the 129.55 support area, marked by the high of Mar. 30, that might spook the remaining bulls from the field temporarily. EUR/JPY could then travel to the 129.17 obstacle, a break of which may open the way for a move to the 128.94 level, marked by the high of Mar. 25 and an intraday swing low of Mar. 29.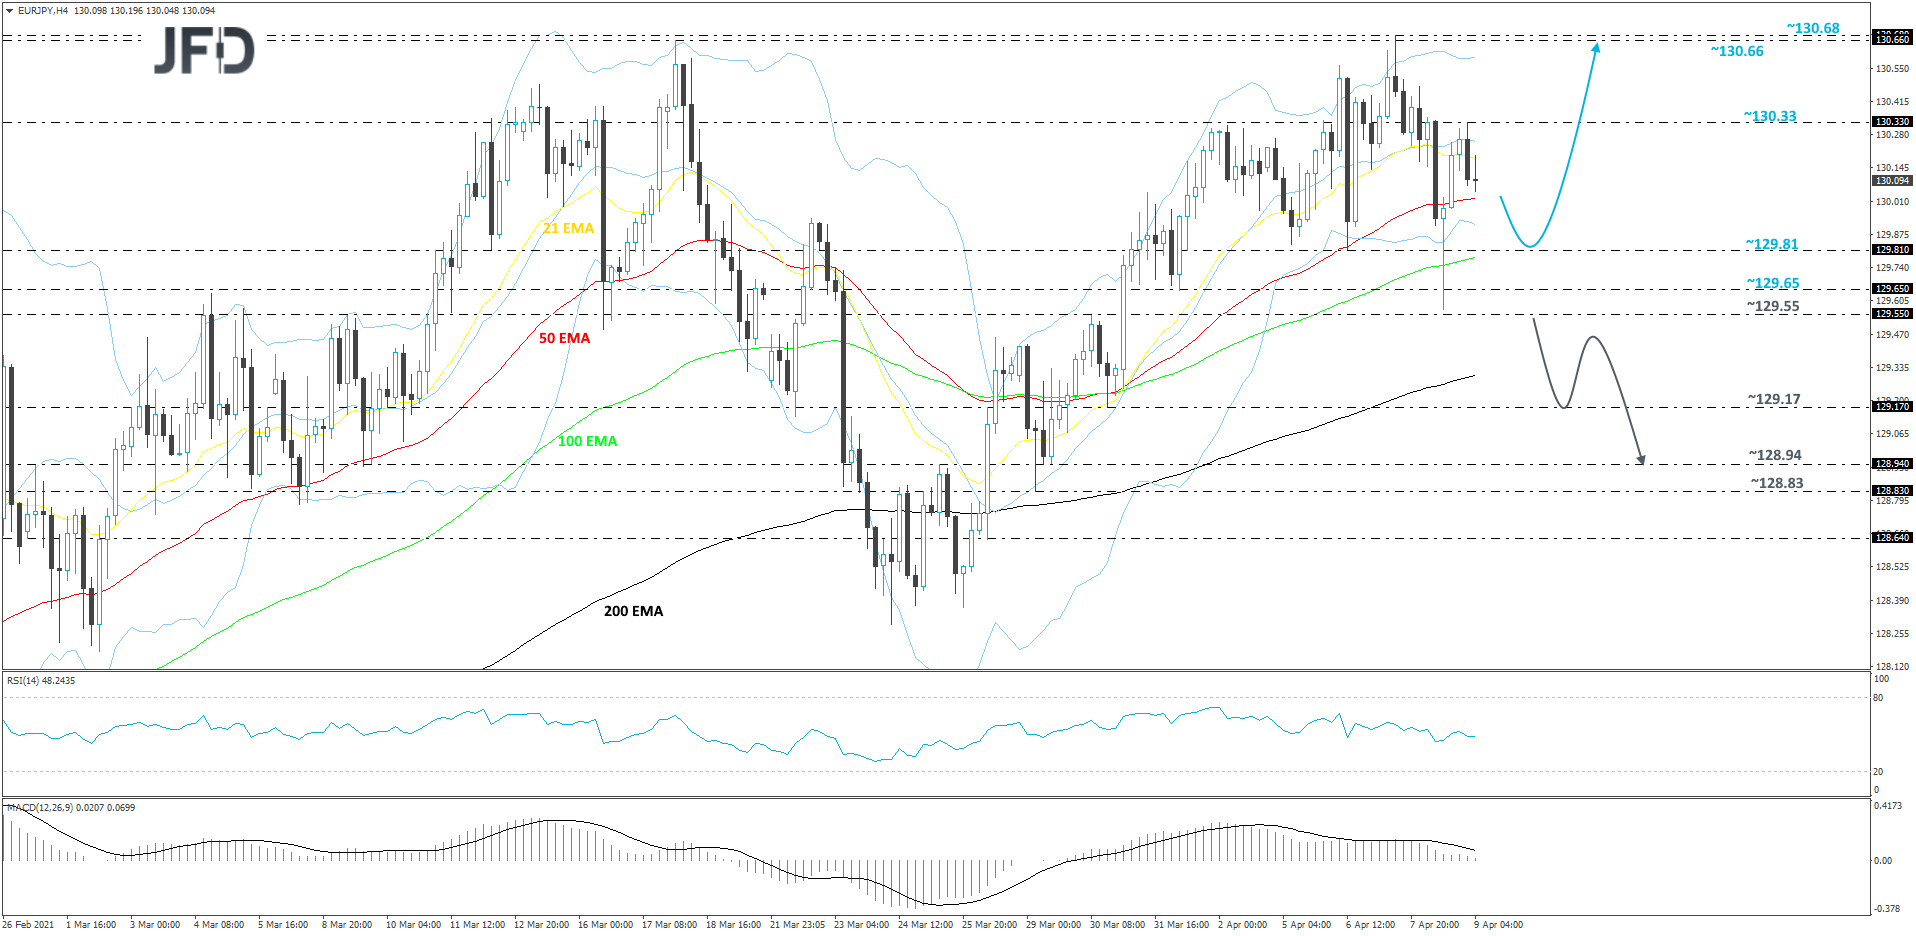
Canada's Employment Report Main Item On The Agenda
As for today, the main event on the economic agenda may be Canada’s employment report for March. The unemployment rate is expected to have declined to 8.0% from 8.2%, while the net change in employment is forecast to show that the economy has added 100k jobs, following a 259.2k gain in February. After such a strong jobs growth in February, a slowdown in March appears more than normal to us, and thus, we would consider this a decent report.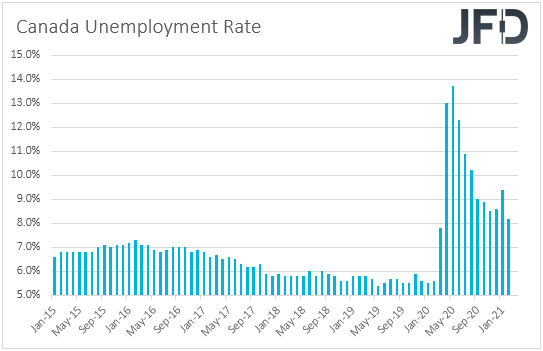
When they last met, BoC officials kept monetary policy unchanged and noted that the economic recovery continues to require extraordinary monetary policy support, until economic slack is absorbed so that the 2% inflation goal is sustainably achieved. According to the Bank’s January projections, this is not expected to happen until into 2023. However, they reiterated that as they continue “to gain confidence in the strength of the recovery, the pace of net purchases of Government of Canada bonds will be adjusted as required”, something that may have kept the door for a QE tapering open. With that in mind, a decent employment report may keep that option on the table and thereby support the Canadian dollar.
AUD/CAD Technical Outlook
In the beginning of this week, after finding resistance near the 0.9650 barrier, AUD/CAD reversed back to the downside. This morning, the pair broke below a short-term tentative upside support line taken from the low of Apr. 1. At the same time, AUD/CAD seems to be forming a potential descending triangle pattern, which tends to be a bearish indication. That said, a break of the lower bound of that triangle, at 0.9589, would be needed, in order to get a bit more comfortable with further declines. We will take a somewhat negative approach for now.
If a drop below the 0.9589 hurdle happens, this will confirm a forthcoming lower low, potentially opening the door for further declines. AUD/CAD might then travel towards the area between the 0.954 and 0.9550 levels, marked by the lows of Apr. 2 and 6 respectively. The pair may stall there for a bit, or even rebound somewhat. However, if the rate continues to trade below the 0.9589 zone, another slide could be possible. The pair might slide back to the above-mentioned support area, a break of which could clear the way for a push towards the 0.9490 hurdle, marked by the current lowest point of April.
Alternatively, if the rate is able to climb back all the way above the aforementioned upside line and the upper side of the triangle, this could help attract more buyers into the game. More buyers might join in if AUD/CAD climbs above the 0.9650 barrier, marked by the current highest point of this week. Such a move would confirm a forthcoming higher high, potentially setting the stage for a further push north, where the rate could test the 0.9681 obstacle, marked by an intraday swing high of Mar. 22. If the buying doesn’t stop there, the next potential target might be near the 0.9714 and 0.9719 levels, marked by the highs of Mar. 22 and 18 respectively.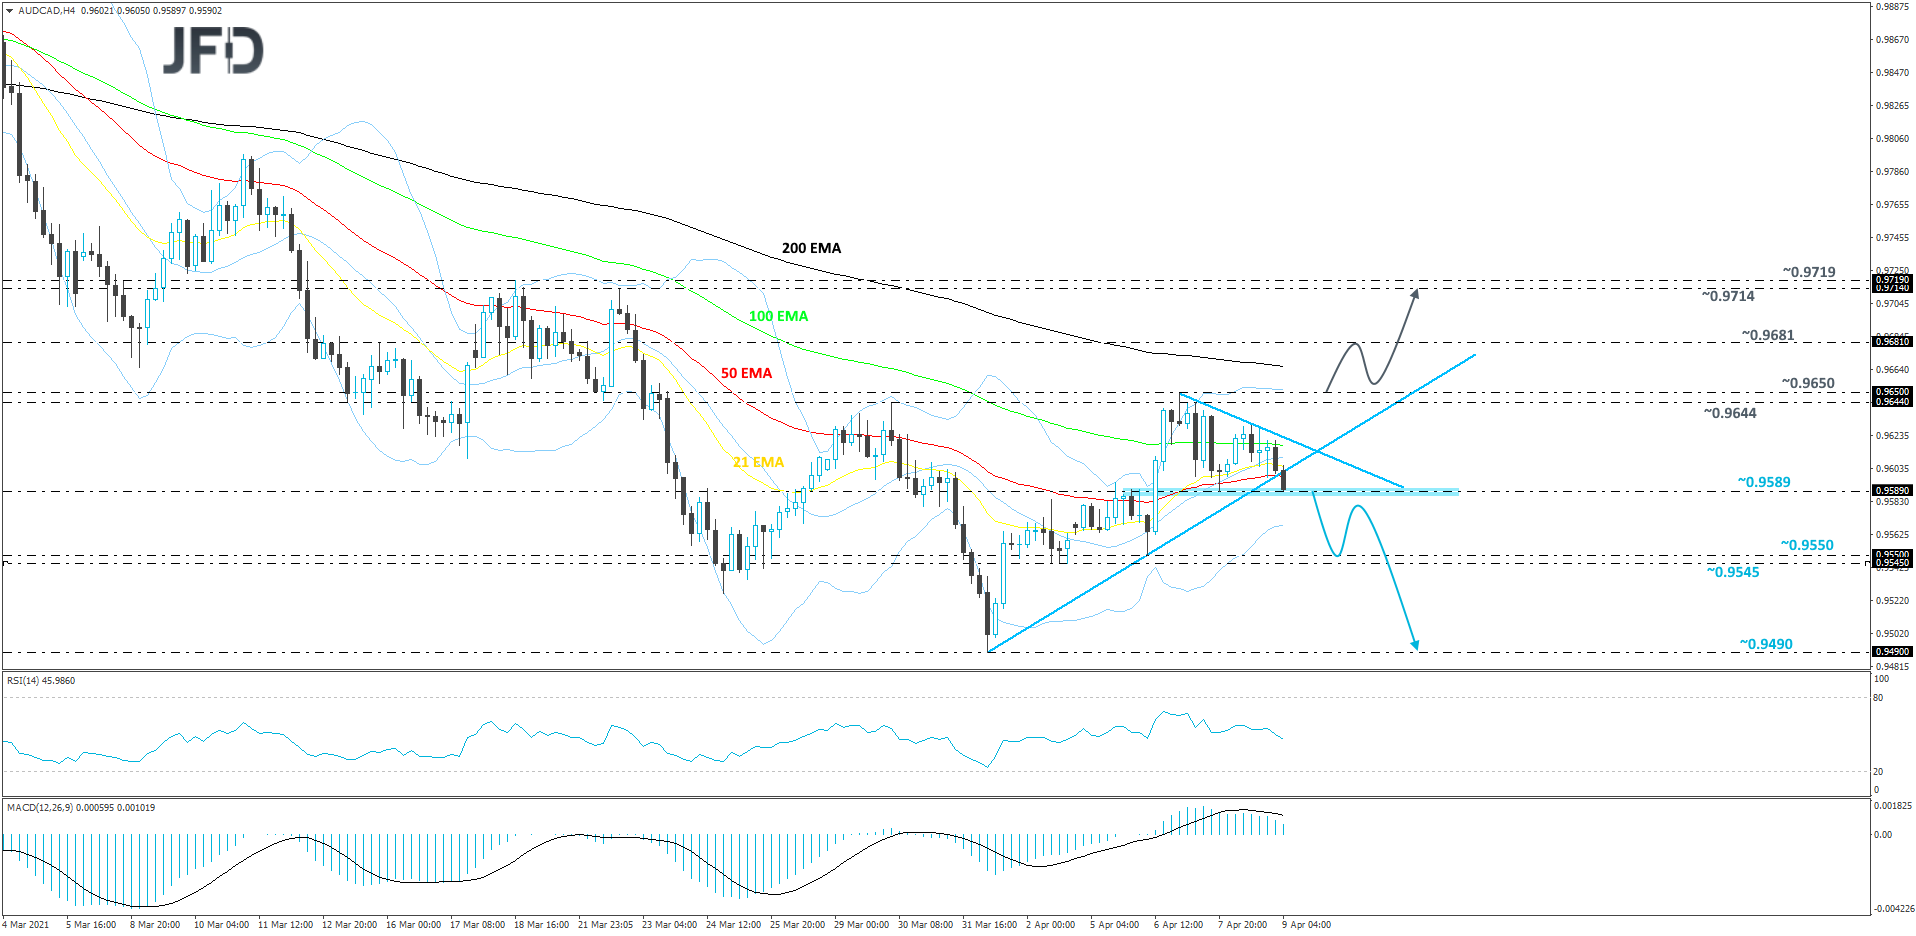
As For The Rest Of Today's Events
Besides the Canadian employment report for March, we also have the US PPIs for the same month. The headline rate is forecast to have risen to +3.8% yoy from +2.8%, while the core one is anticipated to have inched up to +2.7% yoy from +2.5%.
