Friday October 26: Five things the markets are talking about
Asian equities hit 20-month lows overnight, while Euro stocks see red along with U.S futures as nervousness over corporate profits added to investors persistent fears about global trade and economic growth.
Treasuries are steady as the ‘big’ dollar edges higher ahead of today’s U.S Q3 GDP report (08:30 am EDT) – its expected to have slowed, yet remained near its best pace for the past three-years.
Central banks dominated proceedings this week, and they all followed the script, no change for ECB, CBRT, Riksbank and Norges, while the Bank of Canada (BoC) hiked +25 bps and removed ‘gradual’ from their statement – so we are back to data dependency.
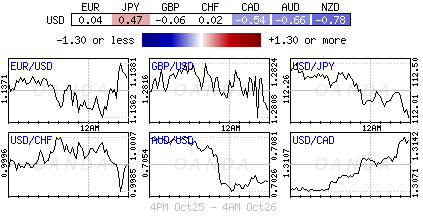
Aside from ‘risk-on’ and ‘risk-off’ trading, rate differentials are the name of the game, and with USD/CHF trading atop of its three-month highs, and through parity, would suggest that rate differentials are currently winning out.
The EUR is under renewed pressure after the ECB acknowledged recent weakness being observed in the E.U data, but stressed it was too early to know if it was not largely being driven by “transitory” factors, whether they are “country-specific” or relate to the eurozone as a whole, and what is impacting consumer spending and what is not. So far, any spill over from Italy to the rest of the eurozone has been “limited.”
1. Stocks plummet again
In Japan, stocks posted their biggest weekly loss in nearly nine-months on growing worries over earnings of domestic firms. The Nikkei share average fell -0.40% overnight, taking the weekly loss to -5.7%. The broader Topix shed -0.31% to also end the week -5.7%.
Down-under, Aussie shares closed flat overnight, but ended the week in the ‘red.’ The S&P/ASX 200 index ended +0.02% up, but, for the week, the benchmark slumped -4.6%. In S. Korea, shares fell for a fourth consecutive session on domestic earnings worries, the Kospi index tumbled -1.75%, leading to a weekly decline of -5.99%.
In China, stocks slipped overnight but posted a weekly gain, supported by Government policies and measures to bolster the stock market and the real economy. The blue-chip CSI300 index fell -0.7%, while the Shanghai Composite Index ended down -0.2%. For the week, the CSI300 index gained +1.2%, while SSEC was up +1.9%.
In Hong Kong, stocks fell on regional cues. The Hang Seng index fell -1.4% overnight, while the Hang Seng China Enterprise index fell -1.7%.
In Europe, regional bourses trade lower across the board led by a weaker tech sector after disappointing results after the N.Y close from Amazon (NASDAQ:AMZN) and Google (NASDAQ:GOOGL).
U.S stocks are set to open deep in the ‘red’ (-1%).
Indices: STOXX 600 -1.5% at 349.9, FTSE -1.6% at 6897, DAX -1.8% at 11101, CAC 40 -2.0% at 4930, IBEX 35 -1.3% at 8668, FTSE MIB -1.7% at 18505, SMI -1.0% at 8620, S&P 500 Futures -1.0%
2. Oil falls on oversupply worries, gold lower
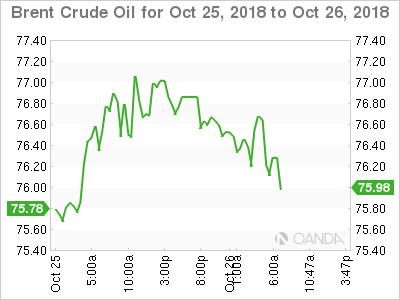
Oil prices are heading for a third consecutive weekly loss after Saudi Arabia warned of oversupply, while a global equity slump and concerns about trade clouded the outlook for fuel demand.
Brent crude oil is down -70c at +$76.19 per barrel, on course for a weekly loss of more than -4% – it has fallen close to -$10 this month, while U.S crude (WTI) is also down -70c at $66.63, set for a -3.5% loss on the week.
After months of concern about shortage of supply ahead of U.S sanctions on Iran, Saudi Arabia’s OPEC governor said yesterday that oil markets could face oversupply by the end of the year.
However, the markets immediate focus remains on U.S sanctions and the impact they are having on Iran’s oil exports.
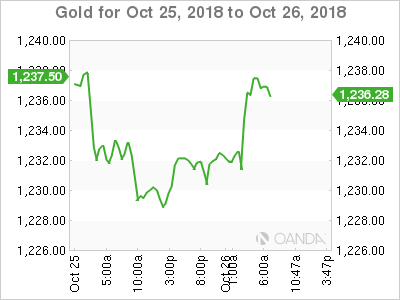
Ahead of the U.S open, gold prices are holding steady on the back of another equity loss overnight, with the metal on track to rise for the fourth consecutive week – its longest string of weekly gains since January. Spot gold is flat at +$1,231.58 an ounce, while U.S gold futures are up +0.1% at +$1,234.10 an ounce.
Note: Earlier this week, it touched a high of +$1,239.68, a peak since July 17. It’s up about +0.4% for the week.
3. Sovereign yields fall again
German Bund yields have hit a six-week low overnight as investor negativity over Italian budget talks and disappointing U.S earnings – Amazon.com (NASDAQ:AMZN and Google (NASDAQ:GOOGL) – is supporting investor appetite to own sovereign debt.
Note: Euro yields were already trading atop of the lows after the ECB stuck to its plans to claw back stimulus this week and Draghi acknowledging a loss of growth momentum and a “bunch of uncertainties” ahead.
German Bunds saw their yields drop -2 bps to -0.378% – that’s -20 bps lower than where it was a fortnight ago.
Italian BTP bonds have also weakened ahead of a today’s ratings review from S&P Global – the agency currently has Italy at a BBB rating with a stable outlook.
Italy’s two-year yields are +4 bps higher at +1.52%, and 5’s are up +2 bps at +2.84%.
Elsewhere, the yield on 10-year Treasuries has dipped -1 bps to +3.10%, while the U.K’s 10-year Gilt yield has fallen -2 bps to +1.42%. In Japan, the 10-year JGB yield has decreased -1 bps to +0.111%.
4. U.S dollar trades at three-month highs
The ‘mighty’ U.S dollar is trading atop of its three months highs against G7 pairs ahead of today’s U.S Q3 GDP data.
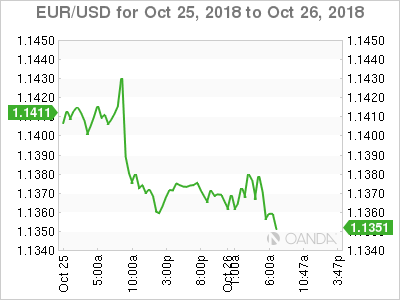
EUR/USD (€1.1369) is currently trading below the psychological €1.14 area as the Italian budget drama remains the markets focus. The S&P rating decision on Italian debt is seen as a non-event – talks between Rome and Brussels is more important.
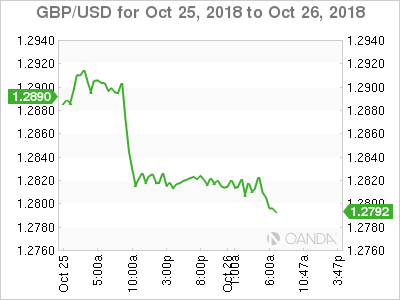
GBP/USD (£1.2808) is little changed as the Brexit impasse continues. Nothing is expected from U.K’s side before Monday’s budget as members within PM Theresa May’s cabinet argue on the approach to negotiations.
Weaknesses in Chinese yuan fix overnight certainly weighed upon other currencies in the region (AUD, NZD, SGD). China fixed the USD/CNY rate above ¥6.95 for first time in nearly two-years.
Note: Chinese officials also declared that they would not engage in competitive devaluation.
5. Consumer climate in Germany remains stable
According to market research GfK this morning, German consumer sentiment is set to stabilize in November “as a result of inconsistent development in mood.”
GfK’s forward-looking confidence index is expected to stay at 10.6 points in November, unchanged from October.
Note: GfK uses three sub-indexes – economic expectations, income expectations and propensity to buy – for the current month to derive a sentiment figure for the next month.
The economic expectations sub-index fell to 19.0 points in October from 27.1 points in September, while the income-expectations sub-index retreated to 54.4 points from 57.9 points, GfK said.
The propensity to buy, a gauge of consumers’ intention to spend on big-ticket items, rose to 55.9 points in October from 52.9 points in September.
