A recent article by Joe Ciolli stated the equity bull market’s biggest catalyst looks like it’s here for the long haul. To wit:
“Profit expansion — which has historically been the biggest contributor to share-price appreciation for US corporations — is churning at a rate not seen in almost six years.“
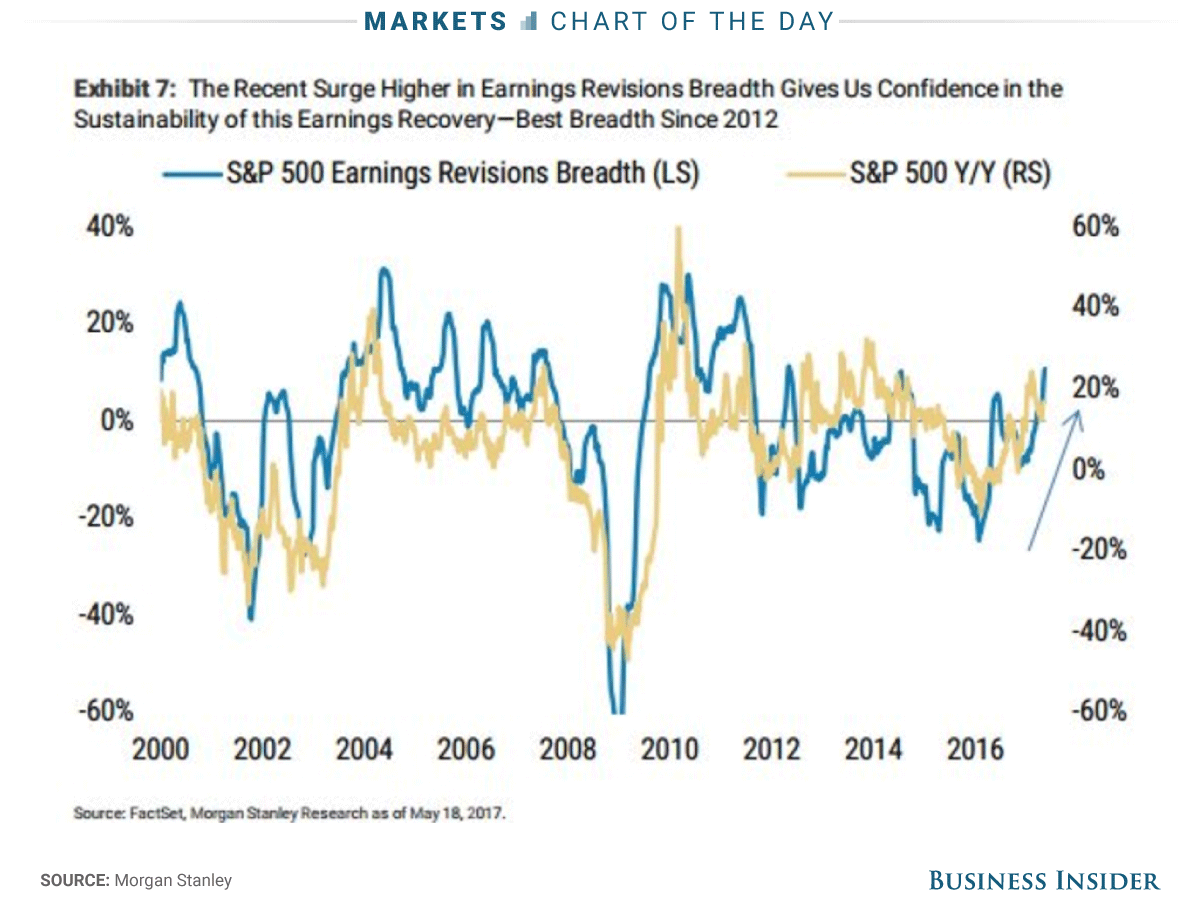
“The recent surge confirms the sustainability of the earnings recovery that started in early 2016,” a group of Morgan Stanley equity strategists led by Michael J. Wilson wrote in a client note. “The momentum of earnings revisions breadth like that seen recently is often synonymous with higher equity prices over a 12-month horizon.”
While the above statement is absolutely correct, the problem is the markets are now on the tail end of that expansion where year-over-year comparisons were extremely easy. As I noted in this past weekend’s newsletter, it is quite likely the spate of earnings growth seen over the last couple of quarters will soon end as year-over-year comparisons get decidedly tougher.
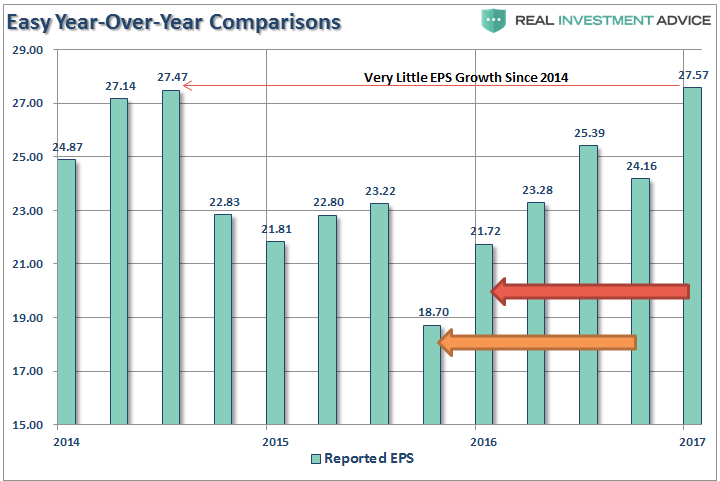
As you can see, both above and below, the market does indeed respond to earnings growth. As stated, with earnings back to their previous peak, the rate-of-change will begin to slow quickly.
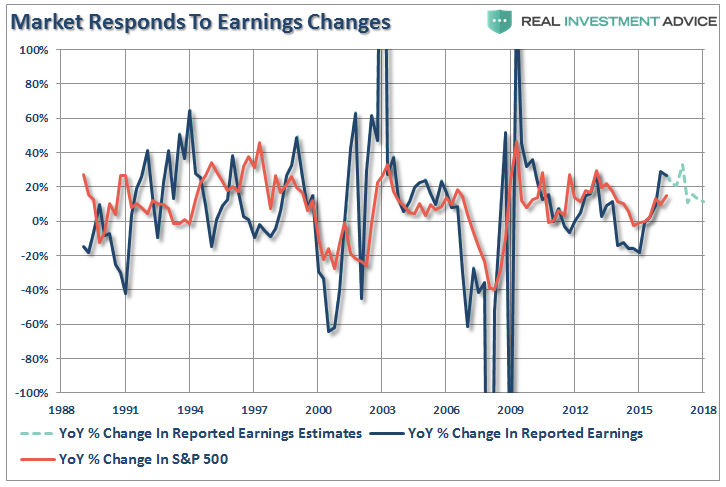
Considering that earnings estimates are generally overstated by roughly 30%, the actual net decline in earnings growth will likely be far sharper than currently anticipated.
More importantly, since the bulk of the expected increase in earnings estimates are based on tax cuts/reforms, when it becomes apparent those legislative policies are not forthcoming, those estimates will be ratcheted lower. With the market trading well ahead of earnings growth currently, the risk of disappointment is extremely high.
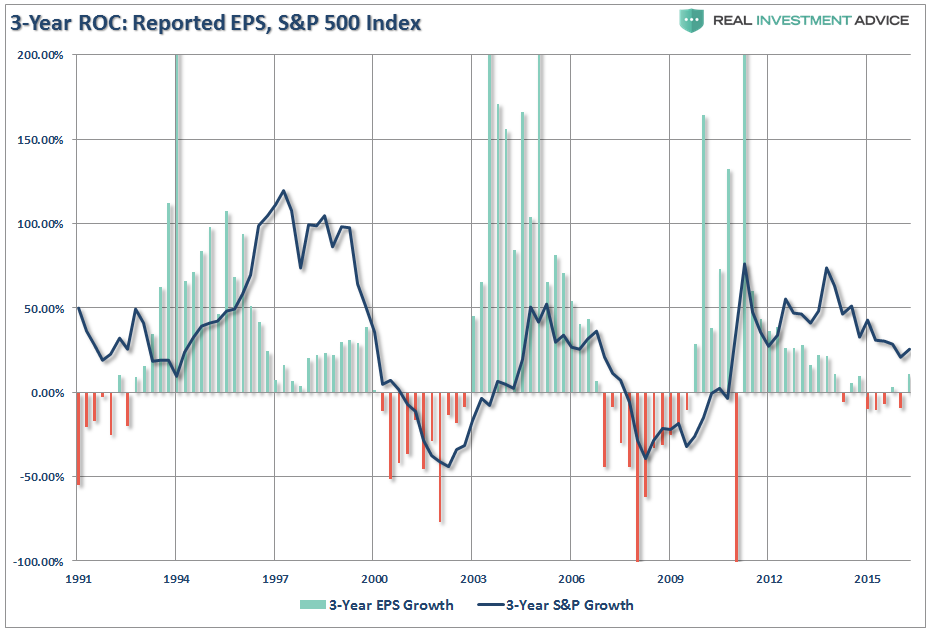
The chart below shows the 3-year rate-of-change in reported earnings per share and the S&P 500. Not surprisingly, considering the cyclical nature of the economy, we are closer to the end of the current cycle than not.
Much of the recent rebound in earnings came from the sharp rise in oil prices as shown below. But, with those prices once again on the decline, it is quite likely forward earnings are overly optimistic currently.
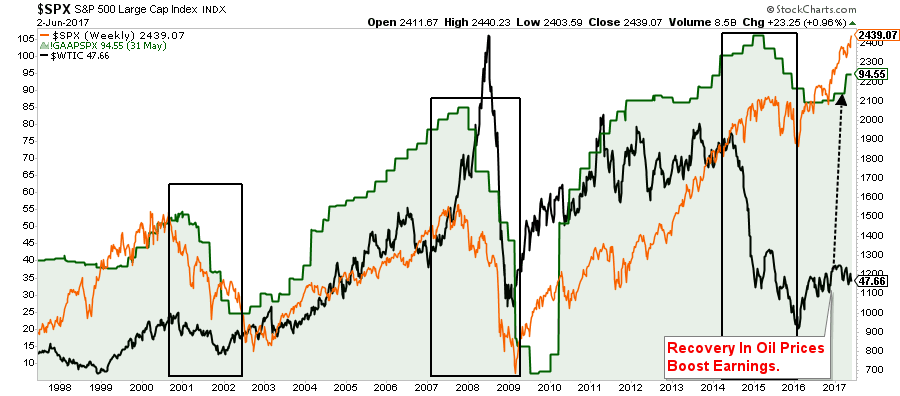
Corporate Profits Tell A Different Story
As I have discussed previously, the operating and reported earnings per share are heavily manipulated by accounting gimmicks, share buybacks, and cost suppression. To wit:
“The tricks are well-known: A difficult quarter can be made easier by releasing reserves set aside for a rainy day or recognizing revenues before sales are made, while a good quarter is often the time to hide a big ‘restructuring charge’ that would otherwise stand out like a sore thumb.
What is more surprising though is CFOs’ belief that these practices leave a significant mark on companies’ reported profits and losses. When asked about the magnitude of the earnings misrepresentation, the study’s respondents said it was around 10% of earnings per share.“
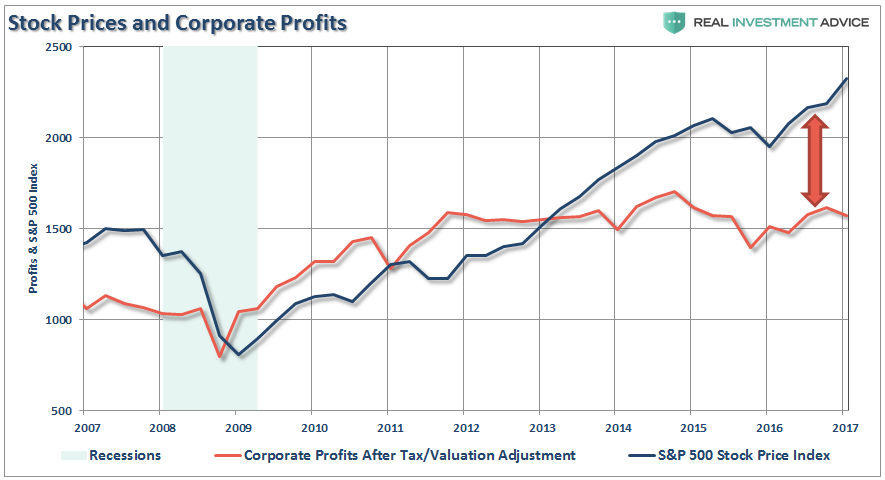
However, if we analyze corporate profits (adjusted for taxes and inventory valuations) we find a very different story. Since the lows following the financial crisis, the S&P 500 has grown by 266% versus corporate profit growth of just 98%.
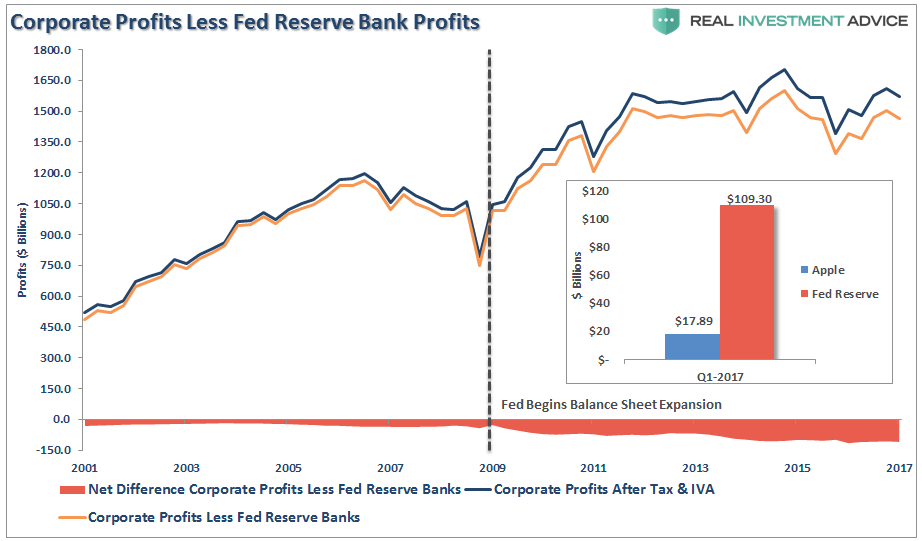
Important Note: The profits generated by the Federal Reserve’s balance sheet are included in the corporate profits discussed here. As shown below, actual corporate profitability is weaker if you extract the Fed’s profits from the analysis. As a comparison, in the first quarter of 2017, Apple (NASDAQ:AAPL) reported a net income of just over $17 billion for the quarter. The Fed reported a $109 billion profit.
With corporate profits still at the same level as they were in 2011, there is little argument the market has gotten a bit ahead of itself. Sure, this time could be different, but it usually isn’t. The detachment of the stock market from underlying profitability suggests the reward for investors is grossly outweighed by the risk.
But, as has always been the case, the markets can certainly seem to “remain irrational longer than logic would predict.” This was something Jeremy Grantham once noted:
“Profit margins are probably the most mean-reverting series in finance, and if profit margins do not mean-revert, then something has gone badly wrong with capitalism. If high profits do not attract competition, there is something wrong with the system, and it is not functioning properly.”
Grantham is correct. As shown, when we look at inflation-adjusted profit margins as a percentage of inflation-adjusted GDP we see a clear process of mean reverting activity over time. Of course, those mean reverting events are always coupled with a recession, crisis, or stock market crash.
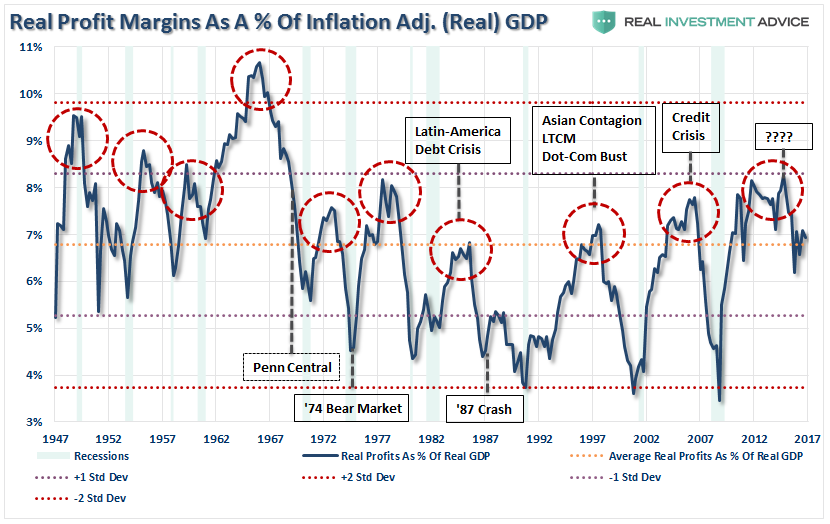
More importantly, corporate profit margins have physical constraints. Out of each dollar of revenue created there are costs such as infrastructure, R&D, wages, etc. Currently, one of the biggest beneficiaries to expanding profit margins has been the suppression of employment, wage growth, and artificially suppressed interest rates which have significantly lowered borrowing costs. Should either of the issues change in the future, the impact to profit margins will likely be significant.
The chart below shows the ratio overlaid against the S&P 500 index.
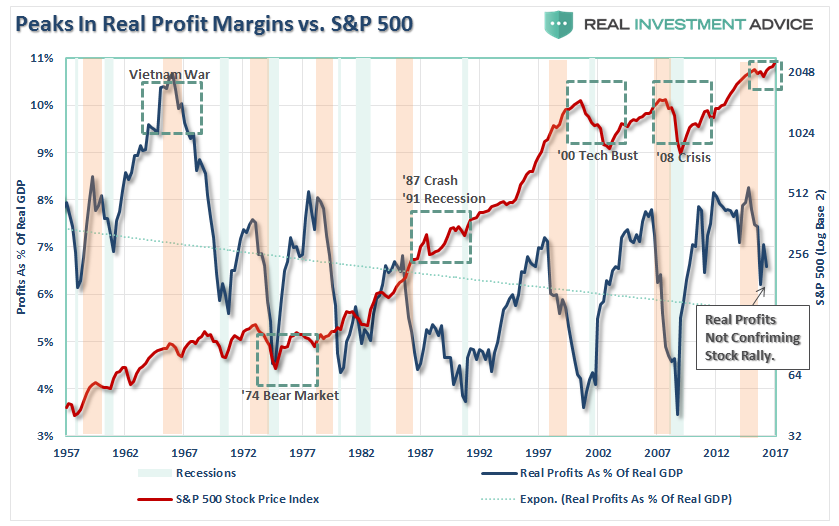
I have highlighted peaks in the profits-to-GDP ratio with the orange vertical bars. As you can see, peaks, and subsequent reversions, in the ratio have been a leading indicator of more severe corrections in the stock market over time. This should not be surprising as asset prices should eventually reflect the underlying reality of corporate profitability.
Of course, it is often suggested that, as mentioned above, low interest rates, accounting rule changes, and debt-funded buybacks have changed the game. While such could possibly be true, it is worth noting that each of those supports are artificial and finite in nature.
Currently, the aging U.S. economy, where productivity has exploded, wage growth has remained weak and whose households are weighed down by surging debt, remains mired in a slow-growth funk. This slow-growth trajectory has, in turn, put a powerful shareholder base to work increasing pressure on corporate managers not to invest, and to recycle capital into dividends and buybacks instead which has led to a record level of corporate debt.
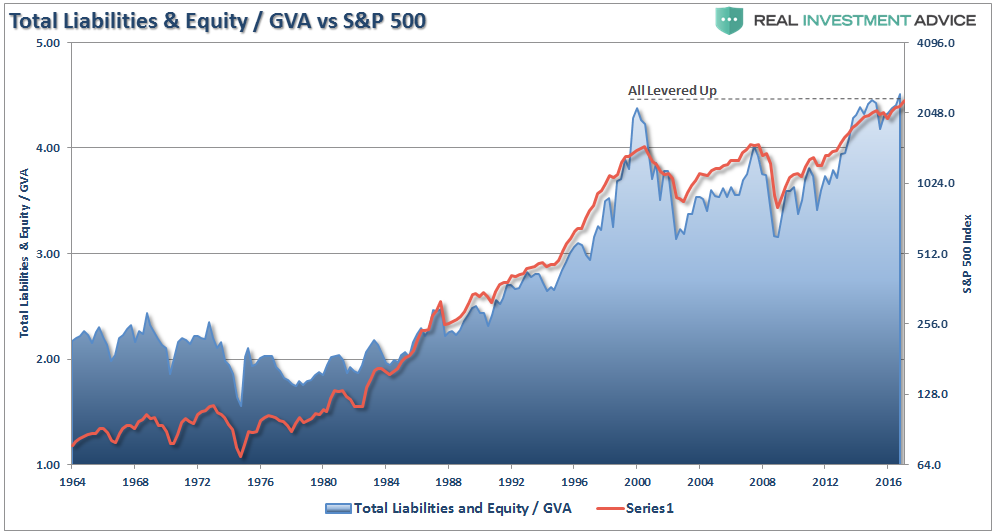
These actions, as suggested above, are limited in nature. For a while, these devices kept ROE elevated. However, the efficacy of those actions have now been reached.
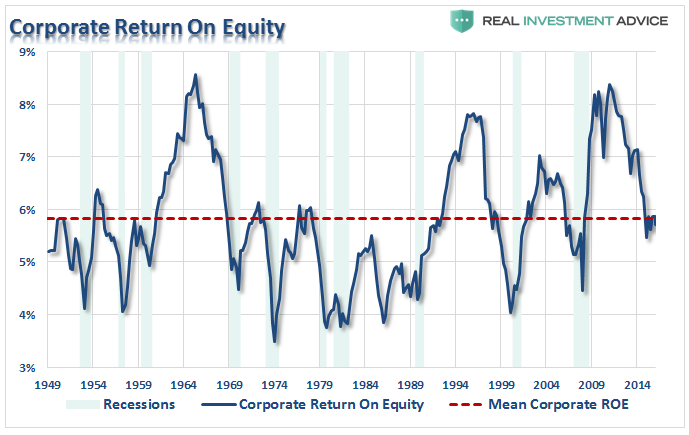
Importantly, profit margins and ROE are reasonably well-correlated which is what creates the perception that profit margins mean-revert. However, ROE is a better indicator of what is happening inside of corporate balance sheets more so than just profit margins. The current collapse in ROE is likely sending a much darker message about corporate health than profit margins currently.
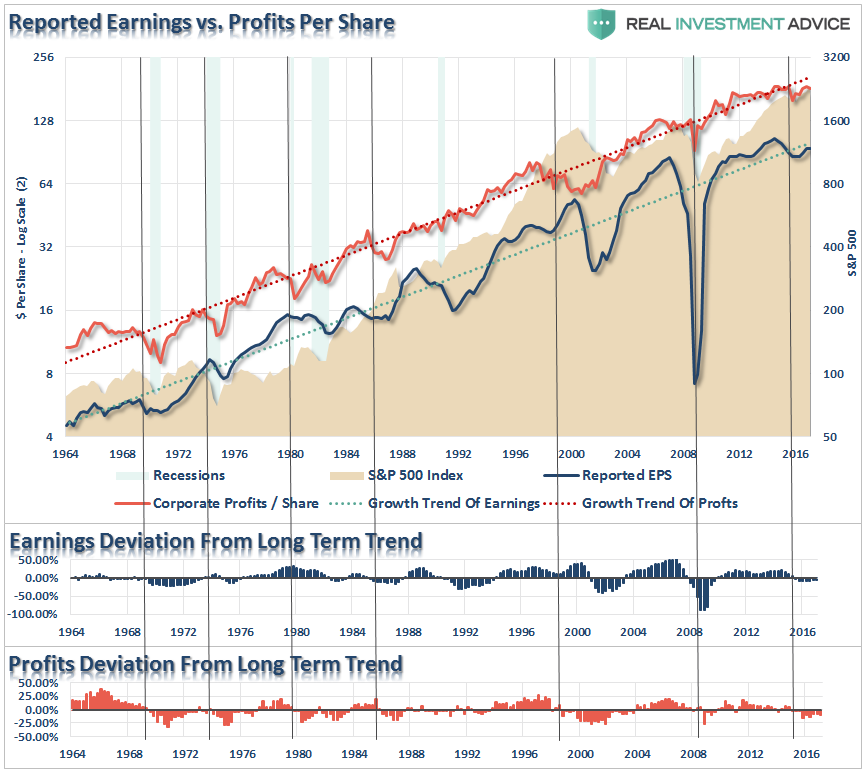
While reported earnings, which are subject to accounting manipulations and share buybacks have indeed declined below the long-term trends, it is not nearly to the extent as shown by both ROE and Corporate Profits.
Furthermore, there has been a lot of focus on traditional P/E ratios which have surged above 25x earnings recently. But, a look at the Price to Corporate Profits Per Share (P/CP) has also exploded to the second highest level on record and, like P/E ratios, is unsustainable long-term.
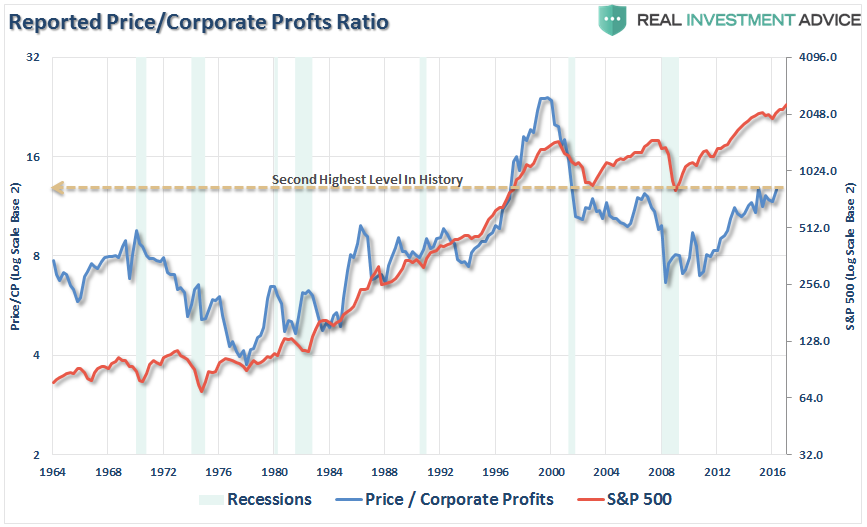
It is unlikely that with reported earnings growth expected to slow in the next quarter, we will see a sharp rise in asset prices during the second half of the year as currently assumed. But, as long as the Fed remains active in supporting asset prices, the deviation between fundamentals and fantasy will likely continue to stretch extremes. Unfortunately, the end result will be the same as it has always been.
While investor appetites for risk remains robust in the short-term, history suggests that such “willful blindness” has led to particularly bad outcomes.
