Thursday March 29: Five things the markets are talking about
As we close out quarter and month-end trading, capital market volumes remain subdued, with many investors preferring to wrap up ahead of the Easter holidays.
All week, investors have been liquidating their tech stocks, selling some of the biggest winners from a ‘bull’ market that’s been tested by rising interest rates and an unpredictable Trump administration.
This morning, Euro equities have climbed after a mixed session in Asia, while U.S futures are rallying as markets limp to the end of turbulent quarter.
Treasury yields have steadied as the ‘big’ dollar heads a tad higher, while the pound is under pressure.
Elsewhere, crude oil prices have rebounded from its longest losing streak in four-weeks, and this despite a build up in U.S stockpiles. Gold remains on the back foot, extending yesterday’s decline.
On tap: U.S personal income and spending data for February are due to be released at 08:30 am EDT, along with Canadian GDP.
1. FANG stocks pressure equity markets
FANG (Facebook (NASDAQ:FB), Amazon (NASDAQ:AMZN), Netflix (NASDAQ:NFLX) and Google (NASDAQ:GOOGL)) names are under significant pressure. It’s no surprise to see trading remaining choppy with the holiday/month/quarter-end calendar seen as a likely volatility inducer. The VIX has lifted back towards 23.
In Japan, the Nikkei share average rallied overnight, helped by gains in domestic-demand stocks. The Nikkei ended +0.6% higher, while the broader TOPIX closed +0.3% up.
Down-under, Aussie shares fell on Thursday, hitting their lowest close in more than five-months; with material stocks leading the losses as a slide in iron ore prices hurt sentiment. The S&P/ASX 200 index fell -0.5%. In S. Korea, the Kospi closed out in similar fashion as the Nikkei, up +0.6%.
In Hong Kong, stocks ended higher amid perceived progress on N. Korea issues, though caution lingered as investors continued to watch the development of China/U.S. trade spat. At close of trade, the Hang Seng index closed +0.2% up, while the Hang Seng China Enterprises index was flat.
In China, stocks reversed earlier losses to end higher overnight, as investors hunted for bargains. At the close, the Shanghai Composite index was up +1.2%, while the blue-chip CSI 300 index was up +1.3%.
In Europe, regional indices are rebounding after yesterday’s losses following a raft of inflation data out of Germany and growth data in the U.K.
U.S stocks are set to open in the ‘black’ (+0.3%).
Indices: STOXX 600 +0.4% at 370.6, FTSE +0.5% at 7079, DAX +0.6% at 12015, CAC 40 +0.5% at 5157, IBEX 35 +1.0% at 9647, FTSE MIB +0.5% at 22440, SMI -0.2% at 8744, S&P 500 Futures +0.3%
2. Oil prices rise as OPEC seen continuing supply cuts, gold unchanged
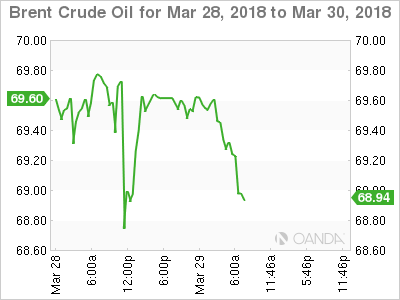
Oil prices have rallied on Thursday, as OPEC and other suppliers look set to continue withholding output for the rest of the year and potentially into 2019.
Brent crude futures are at +$69.76 per barrel, up +23c, or +0.3%, while U.S. WTI crude futures are at +$64.63 a barrel, up +25c, or +0.4% from Wednesday’s close.
OPEC together with a group of non-OPEC producers led by Russia started cutting output in 2017 to rein in oversupply and prop up the market. There are rumblings this week that OPEC and its allies are keen to keep this deal on cutting production for the rest of 2018.
Despite this, Brent remains below the psychological +$70 handle and WTI under +$65 per barrel, weighed by rising crude inventories and production in the U.S.
Note: EIA data yesterday showed that commercial U.S. crude inventories rose by +1.6m barrels in the last week to +429.95m barrels.
In China, Shanghai crude oil futures opened their morning session down nearly -2%, pushing the new market near to parity with U.S. prices, before closing at 409.7 yuan ($65.18) per barrel.
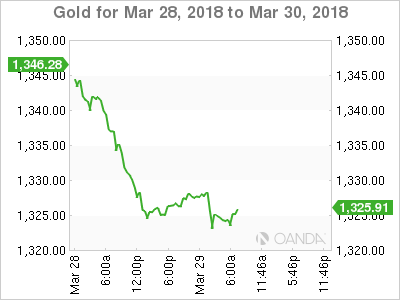
Ahead of the U.S open, gold prices are holding steady this morning, a day after posting its biggest one-day percentage fall in nearly 9-months, as tensions over N. Korea and global trade eased. Spot gold is unchanged at +$1,325.16 per ounce, after hitting a low of +$1,322.50 earlier in the session, it’s lowest since March 21.
Note: The ‘yellow’ metals prices dropped -1.5% on Wednesday, its biggest one-day percentage decline since July 3, 2017.
3. Sovereign yields remain tight
Narrow ranges across Bunds and most Euro and U.S. spreads amid lower volumes, despite the U.S ‘s record supply, suggest that the fixed income market has already entered Easter mode.
Note: In total and by week’s end, the U.S. Treasury will have auctioned approximately +$294B of bills and notes, its largest slate of supply ever.
Ahead of the U.S. open, the yield on 10-year U.S. Treasuries has dipped -1 bps to +2.78%, the lowest in more than seven-weeks. In the U.K, the 10-year Gilt yield has advanced +1 bps to +1.366%, the biggest gain in more than a week, while in Germany, the 10-year Bund yield increased + 1bps to +0.51%, the first advance in more than a week.
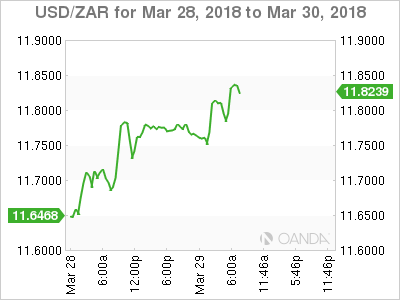
Yesterday, the South African Reserve Bank (SARB) cut interest rates by an expected -25bps to +6.50%. The SARB said the inflation outlook has improved and that “one increase of +25 bps is now implied” instead of three increases of +25 bps by the end of 2019, as previously indicated. South African policy makers expect inflation at +5.2% in 2019, instead of +5.4% previously. For 2018, the central bank hasn’t changed its forecasts and still sees inflation at +4.9%.
4. Dollar confined to trading ranges
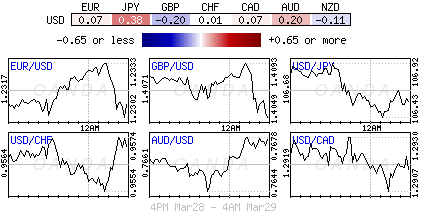
It’s no surprise to see FX price action uninspired ahead of the long holiday weekend and this despite a plethora of European economic releases.
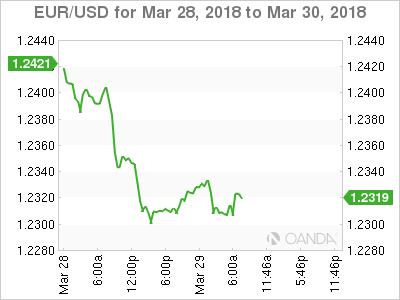
EUR/USD (€1.2309) hovers under the psychological €1.24 level as various German individual states release their March CPI data – most have come in below expectations – dealers are waiting for the overall German inflation data print due out later today. The regional CPI prints reinforce some of the recent cautious remarks by ECB officials on making any abrupt changes in its policy and giving more time to decide about its future moves until summer period.
Sterling is under pressure from quarter-end selling, and seems to be unmoved by this morning’s U.K GDP data (unchanged at +0.4% q/q, but confirmed its slowest annual pace in eight years at +1.4% y/y). GBP/USD is trading roughly at the same level it was before the data release, at £1.4053, down -0.2% on the day.
5. German jobless rate hits record low
Data in Europe this morning showed that Germany’s jobs boom continued this month, as jobless claims fell by more than expected and the unemployment rate hit a new record low.
German jobless claims dropped by -19K in March. The market was forecasting a decline of -17.5K.
This has led to Germany’s adjusted jobless rate easing to +5.3% from +5.4% in February, which marks the lowest rate since the beginning of the data series in January 1992.
Analysts expect Germany’s jobs market to remain tight this year.
