Friday June 21: Five things the markets are talking about
Global equities had a mixed session overnight while U.S futures edged lower this morning in a week that market ‘bulls’ have been able to run rampant aided by the support of G7 central banks change in monetary policy rhetoric back to stimulus mode. U.S Treasuries have ticked a tad higher while the ‘big’ dollar atop of recent range lows.
In commodities, the safe haven gold managed to trade above +$1,400 an ounce for the first time in six years, while oil prices have eased from this week’s highs on renewed U.S/Iran tensions.
However, geopolitical risk remains front and center, after reports that President Trump had approved strikes against Iran in retaliation for downing a U.S drone, but then called off the operation.
In the U.K, the Conservative Party leadership voting results for the fifth round saw Michael Gove eliminated – Boris Johnson is to face Jeremy Hunt in final party-wide vote next month.
On tap: Canada retail sales (08:30 am ET).
1. Stocks rally fades for now
In Japan, the Nikkei fell overnight as investors awaited cues from Sino-U.S trade talks, while oil and mining shares were in demand amid rising geopolitical risks in the Middle East. Index fell -1% but rose +0.7% for the week on ‘easy’ G7 monetary policy talk.
Down-under, Aussie stocks closed lower but still posted weekly gains on hopes of further interest rate cuts by the Reserve Bank of Australia (RBA). The S&P/ASX 200 index to fell -0.6% at the close. The benchmark added +1.5% for the week. In S. Korea, the KOSPI index fell -0.27% overnight, but gained +1.44% for the week.
In China, stocks ended firmer as Beijing and Washington prepared for fresh trade talks and regulators promised start-ups easier access to funding. At the close, the Shanghai Composite index was up +0.5%. The index gained +4.2% this week. The blue-chip CSI300 index added +0.1% and total gains of +4.9% for the week. In Hong Kong, the Hang Seng fell -0.4%.
In Europe, regional bourses trade mixed following a weaker overnight session in Asia and lower U.S index futures, as tensions in Iran weigh.
U.S stocks are set to open in the ‘red’ (-0.2%).
Indices: STOXX 600 +0.1% at 386.5, FTSE +0.3% at 7446, DAX +0.3% at 12390, CAC 40 +0.5% at 5562, IBEX 35 +0.8% at 9277, FTSE MIB +0.5% at 21457, SMI -0.5% at 9958, S&P 500 Futures -0.2%.

2. Oil slips, but still gains for the week as Mideast tensions grow, gold shines
Oil prices are lower, but benchmark Brent crude is set for its first weekly gain in five-weeks amid rising tensions in the Middle East and on hopes for a drop in U.S interest rates that may stimulate global growth.
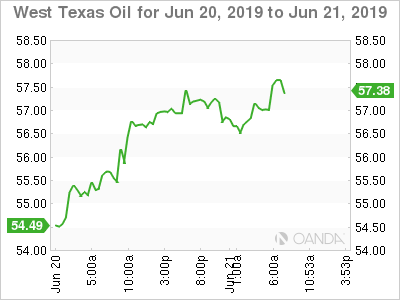
Brent crude is down -20c, or -0.31% at +$64.25 a barrel. The benchmark jumped +4.3% yesterday, leaving it set for a weekly gain of almost +4%. U.S West Texas Intermediate (WTI) is down -16c, or -0.28% at +$56.90 a barrel. However, the benchmark rallied +5.4% yesterday and is set for a weekly increase of + 8%.
Providing support for ‘black gold’ is the uptick in tensions in the Middle East after tanker attacks there last week. Washington blames Iran, but Tehran denies any involvement. reports that President Trump had approved strikes against Iran in retaliation for downing a U.S drone yesterday, but then called off the operation.
The market is also waiting for the OPEC+ meeting where members will decide whether to extend a supply reduction pact that ends this month. Earlier this week, OPEC agreed to move its next meeting to July 1, followed by a meeting with non-OPEC allies on July 2, while the joint technical committee will meet June 30.
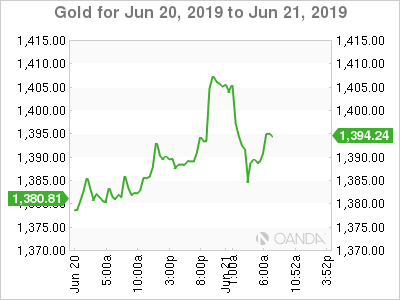
Ahead of the U.S open, gold has jumped to a six-year high earlier this morning, beating the key +$1,400 level before scaling some gains. The ‘yellow metal’ is headed for its best week in more than three years on dovish signals from G7 central banks and rising tensions in the Middle East. Spot gold is up +0.3% at +$1,391.50 per ounce – earlier it hit its highest since 2013 at +$1,410.78. U.S gold futures are steady at +$1,396.30 an ounce.

3. Yields push back
Euro regional government bond yields have backed up a tad this morning after news that business activity in the bloc had picked up this month, but the data was not strong enough to shift market expectations that an ECB rate cut is likely soon.
Across the single-currency bloc, 10-year eurozone bond yields are +2-3 bps higher in this morning’s session.
Note: Money markets are “fully” pricing in a -10 bps rate cut at the ECB’s September meeting.
The German 10-year Bund yield is +3 bps higher at minus -0.29%, not far off this week’s record low yield of -0.33%. Spanish 10-year bond yields are down -10 bps this week, declining for the ninth straight week, while in Italy, the 10-year BTP yield is trading at +2.14%, down some -18 bps this week.
Stateside, the yield on 10-year Treasuries have eased -1 bps to +2.02%, the lowest in more than two-years. In the U.K, the 10-year Gilt yield has gained +2 bps to +0.825%.

4. Dollar finds some late traction
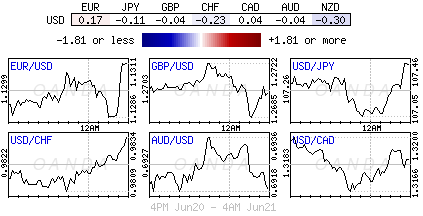
The U.S dollar index futures continue to find some traction on tensions between Iran and the U.S after President Trump called for (then retracted) targeted strikes in Iran in retaliation against the downing of US drone this week.
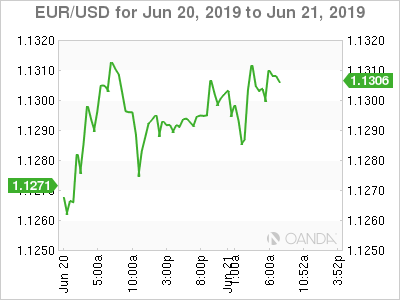
The EUR (€1.1298) has pared gains slightly after the flash purchasing managers’ index on eurozone manufacturing activity came in at 47.8. Pullbacks, for now, are limited as eurozone services PMI was better than expected at 53.4, versus forecasts of 52.8. German manufacturing PMI earlier also beat forecasts, albeit remaining at a very weak 45.4.
GBP (£1.2663) traded higher yesterday but has since given up some ground as dealers focus on the Tory leadership race for the PM position. The final two are as expected Boris Johnson and Jeremy Hunt. They both look to take the U.K out of the E.U by the end of October. The recent strength however is more than likely down to USD weakness.

5. Euro-flash PMI hits seven-month
Data this morning showed that the pace of eurozone economic growth remained subdued this month but has edged up for a second successive month to reach a seven-month high.
Growth was driven by the service sector, which helped offset an ongoing manufacturing downturn. However, optimism about the future meanwhile has dipped lower.
The IHS Markit Eurozone Composite rose to +52.1 in June. This morning’s reading puts growth in Q2 up slightly q/q, despite recording the second-lowest since Q4, 2014.
Growth was driven by the service sector, while in contrast, manufacturing remained in decline, with output falling for a fifth consecutive month.

