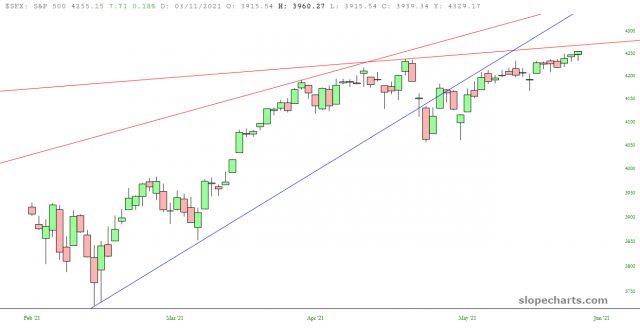
There are plenty of sections of the equity “market” that are making lifetime highs on a nearly daily basis. In spite of anemic volume and pint-sized daily ranges, equities keep muscling their way to new records, such as with the S&P 500:
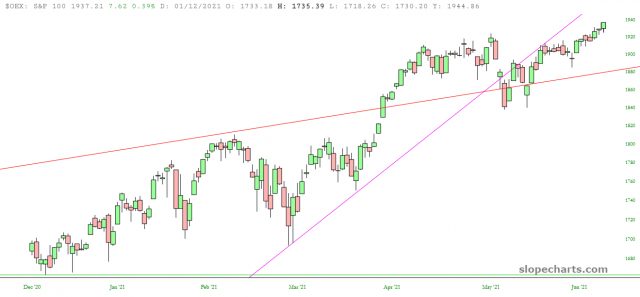
As well as its smaller relative, the S&P 100:
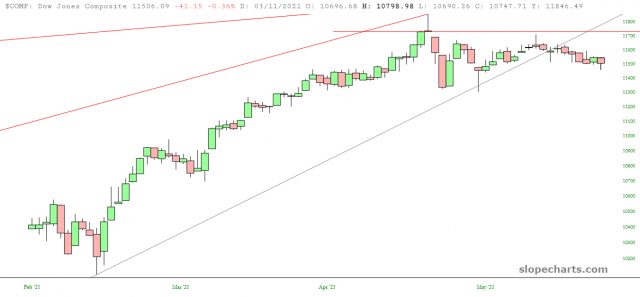
Of course, the Fed-fueled fantasy of daily lifetime highs is not across the board. Looking at the Dow Composite—which, let’s admit, is not some third-rate obscure index but instead represents the important triumvirate of the Utilities, Industrials and Transports—has been moving in sharp divergence with the likes of the S&P, inching lower day by day.
The real question, which I suppose will be resolved by that traitorous coward Jerome Powell this Wednesday, is whether we get a clear break to the upside by way of the giant tech stocks. Over the course of this year, tech has formed two very “V” shaped patterns, the top of which represents a higher high, and we’re quite close to what could either be a breakout or, as before, exhaustion at the trendline to be followed by diminishment.
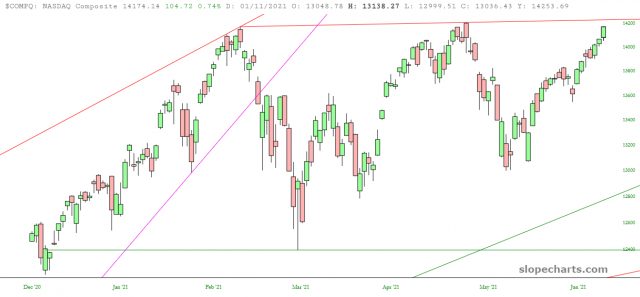
Thus, there’s a lot riding on the market’s interpretation of whatever propaganda is trotted out on Wednesday afternoon. (Thinking out loud: I wonder if there’s any chance—any chance at all—that Powell will mention that their dual mandates is low inflation and full employment, and that what he’s doing is for the good of everyday American people? Gee, I hope he does!)
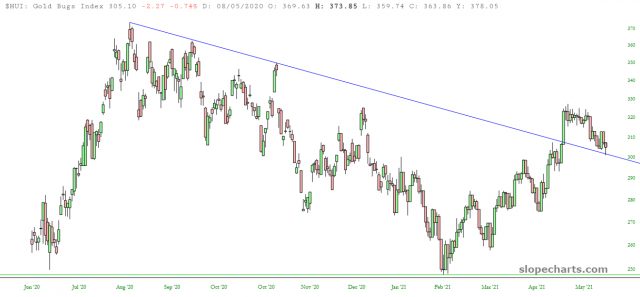
As a side note, the Gold Bugs index has been slipping badly for two weeks, but it is holding its own, in respect to its not violating its own breakout trendline.
