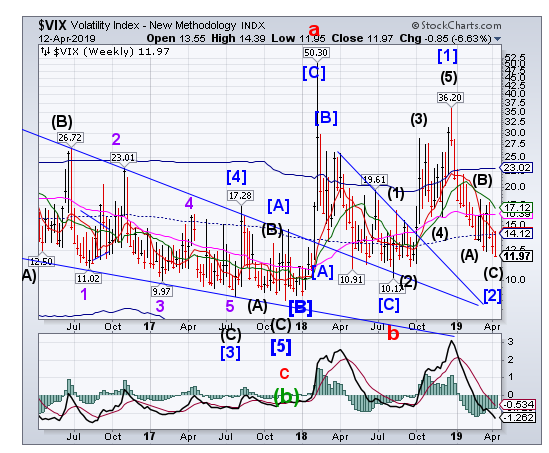
VIX closed at a low not seen since October 3, 2018. This may also be considered a Master Cycle low, which often results in a 3-week rebound. A rally above the mid-Cycle and Short-term resistance at 14.12 may result in a buy signal.
(Bloomberg) A small band of humans is taking up arms against the rise of the machines. Fund managers who ride big sell-offs in stocks are relishing fresh Wall Street warnings that robots and the like are leaving the bull market more vulnerable to explosions in volatility and crashes in liquidity.
They’re ready to pounce when the herd -- from quants to passive money -- is forced to unwind in a downturn just as the relative firepower of fundamental managers to buy the dip gets depleted.
SPX is testing a trendline.
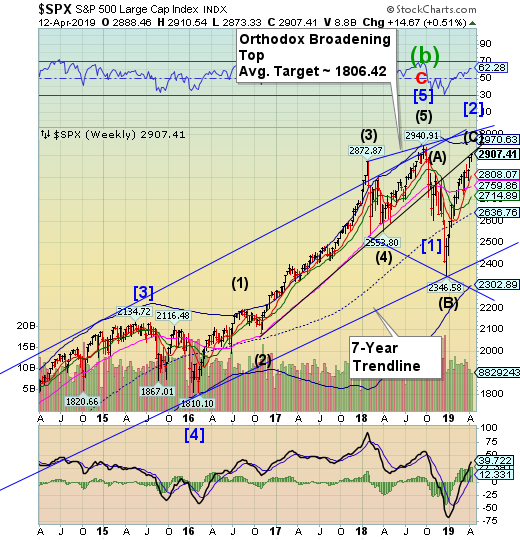
Is testing the 2.5-year trendline originating from the 2016 election for a second week. It has not breached the October 3 high. It may be forming “Point 5” in the Orthodox Broadening Top formation. A sell signal may be generated beneath Short-term support at 2808.07.“Point 6” lies beneath the December 26 low.
(Bloomberg) U.S. stocks rose amid solid bank earnings and a major deal in the energy sector, while Treasuries fell as Chinese data bolstered optimism in the global economy.
The S&P 500 gained for a third straight week as it punched through the key 2,900 level for the first time in six months. JPMorgan Chase & Co (NYSE:JPM). surged on a strong first-quarterreport, while Walt Disney (NYSE:DIS) Co. jumped to a record after it announced a new streaming service, sinking Netflix Inc (NASDAQ:NFLX).’s shares.
Anadarko Petroleum Corp (NYSE:APC). soared along with shares in its competitors after Chevron (NYSE:CVX) agreed to buy the energy producer. Chevron slumped. Health-insurer stocks slid for a second day as policy makers in Washington spared over proposals that threatened to disrupt their businesses, weighing on the Nasdaq indexes.
NDX retraces 95% of last year’s decline.
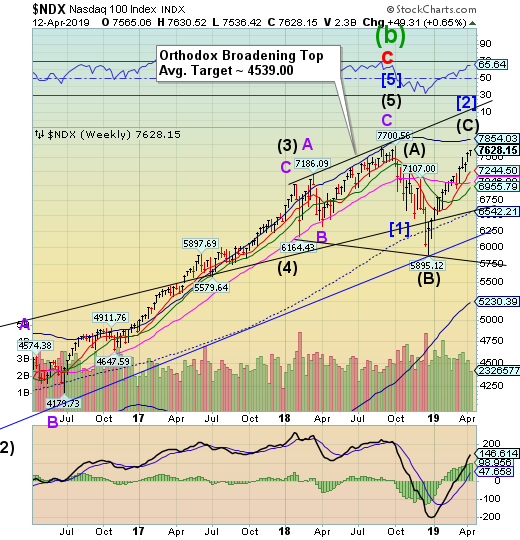
NDX has also arrived at a potential “point 5” of an Orthodox Broadening Top formation. Be aware that this formation occurs at a Primary Degree level which involves some very large moves, as we have already seen. A sell signal awaits beneath Short-term support at 7244.50.
(Bloomberg) Two Wall Street strategists downgraded technology stocks, saying this year’s market-leading rally has stretched valuations to extremes and is unlikely to last.
Sean Darby, chief global equity strategist with Jefferies, lowered his view on the industry to modestly bearish, citing concern that tech shares have run ahead of fundamentals. Noah Weisberger at Sanford C Bernstein & Co. reduced his rating to market-weight from overweight, saying the industry is “unjustifiably rich.”
The downgrades come after tech stocks soared 23 percent this year, defying a deteriorating earnings picture. The group has beaten all other major S&P 500 industries as investors keep chasing winners.
High Yield Bond Index tests the Cycle Top.
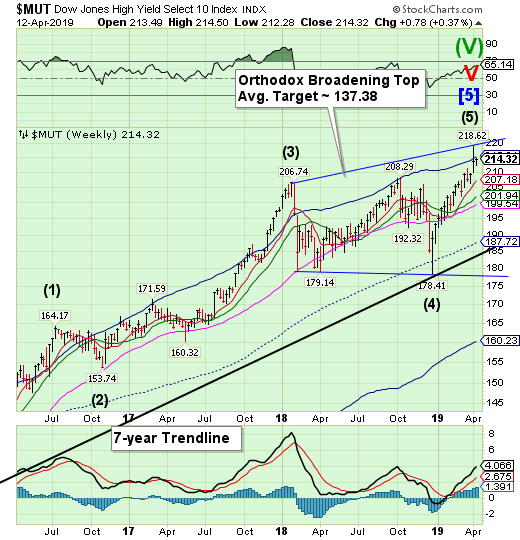
After its “exhaustion peak” last week, the High Yield Bond Index has been testing its Cycle Top resistance at 215.21. This concludes a probable point 5 of an Orthodox Broadening Top and the onset of a probable sell signal. Point 6 may be the Cycle Bottom at 160.23. The Cycles Model warns of a probable decline to the month-end or longer.
(ZeroHedge) Bond investor euphoria was rampant yesterday, with virtually everyone rushing to get an allocation in the historic (if perplexing) $12 billion Aramco debt sale, which ended the day with a record orderbook of over $100 billion, roughly 10x oversubscribed, and the highest ever for any bond offering even surpassing Verizon (NYSE:VZ)'s 2013 historic bond sale. Or so the underwriters claimed.
In reality, when the Aramco $12 billion bonds broke for trading, they posted very modest gains on Wednesday, suggesting that the $100 billion in orders were mostly vapor and that "the record-
breaking demand was inflated" according to three banking and investment sources quoted by Reuters.
Treasuries pull back to Short-term support.
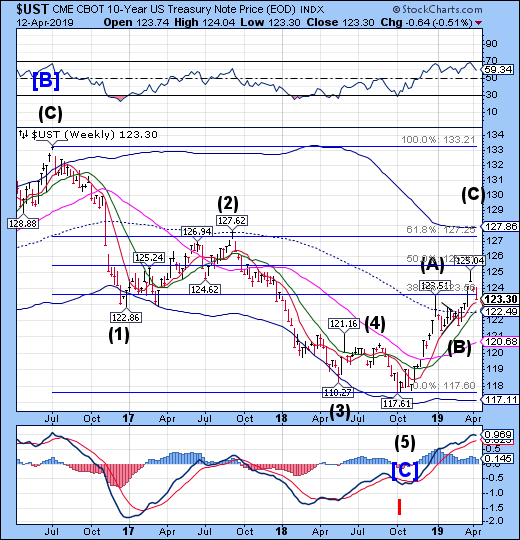
The 10-Year Treasury Note Index pulled back further, testing Short-term support at 123.13. That said, it remains on a buy signal with a potential target at the Cycle Top resistance at 127.88. The Cycles Model suggests the pullback may be finished.
(CNBC) U.S. government debt yields followed international rates higher Friday as investors in the United States pivoted toward riskier assets on the week’s final day of trade.
The yield on the benchmark 10-year Treasury note rose to about 2.558%, while the yield on the 30-year Treasury bond also climbed to 2.971%. Bond yields move inversely to prices.
Much of the weekend optimism stemmed from new economic data that showed Chinese bank lending was on the rise in March and that the country’s trade surplus soared beyond analyst expectations.
The Europe merges from a potential low.
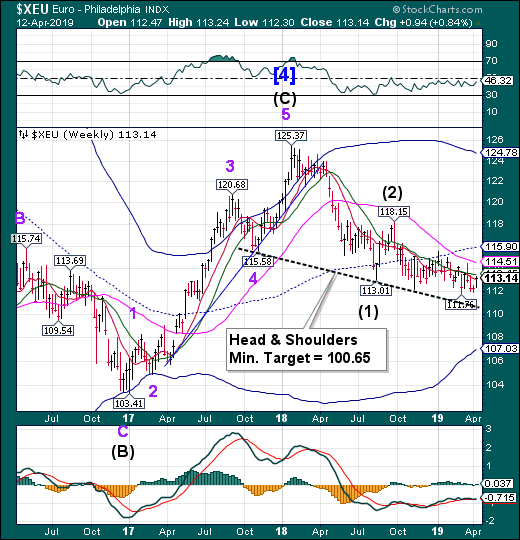
The euro may have reached a Master Cycle low last week. If so, the euro may rally through the end of April. In that scenario, the euro may rise to Long-term resistance at 114.51. However, the longer-term trend appears to be down.
(CNBC) The dollar slipped on Friday to its lowest against the euro in more than two weeks on reports a foreign bank was preparing to fund an acquisition of a European company, while signs of economic stabilization in China and a strong start to U.S. corporate earnings season boosted demand for riskier assets.
The euro was 0.38% higher against the dollar at $1.1293, its highest since March 26. Dealers attributed part of the euro’s strength to anticipated currency demand arising from a Japanese bank’s plans to purchase a German multibillion-dollar aviation finance business.
Euro Stoxx rallies above mid-Cycle Resistance.
Note: StockCharts.com is not displaying the Euro Stoxx 50 Index at this time.
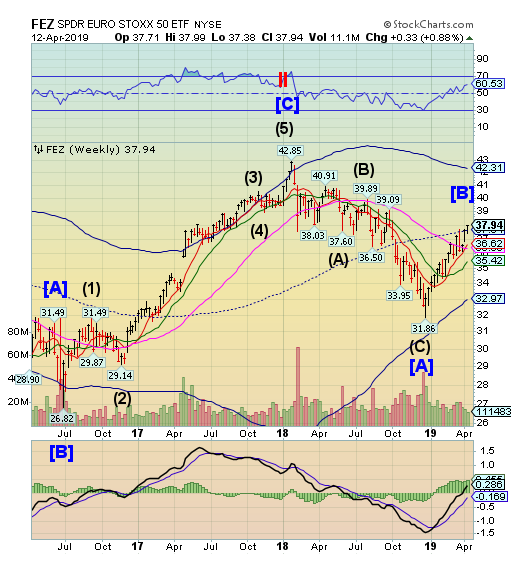
The EuroStoxx50 SPDRrose above mid-Cycle resistance at 37.64, closing above it and making a new retracement high.However, the rally may be complete. The Cycles Model suggests a month of decline may lie ahead.
(CNBC) European stocks closed slightly higher Friday as economic data, early first-quarter results and Brexit relief calmed fears over the region’s economy.
The pan-European Stoxx 600 closed provisionally around 0.1% higher, with sectors and major bourses mostly in positive territory.
Looking at individual stocks, Danish hearing aid manufacturer GN Store Nord’s shares surged to the top of the European benchmark, gaining almost 8% after the company upgraded its revenue growth guidance following a strong start to the year.
The Yen tests the lows.
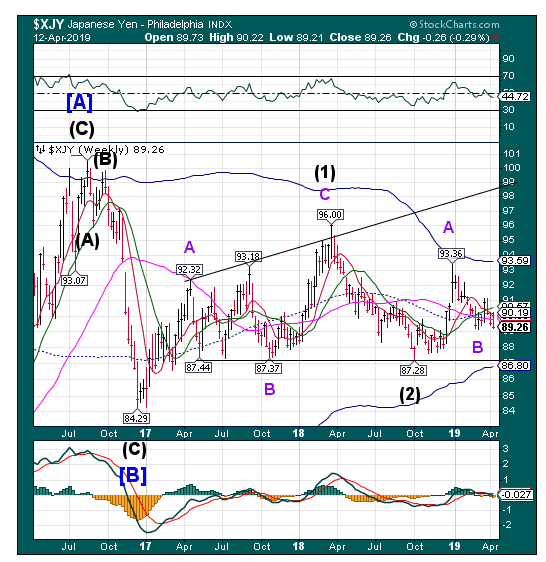
The yen tested its March low, but did not exceed it. While making it difficult for recent investors, the structure of the uptrend has not been violated. The Cycles Model suggests a rally in strength through the end of April.
(Bloomberg) A senior official at the International Monetary Fund defended the Bank of Japan’s 2 percent inflation target as appropriate and important to achieve.
“Two percent is what the central banks of major economies are pursuing,” Odd PerBrekk, deputy director of the Asia-Pacific department, said in an interview on Thursday. “Over time, if this can be accomplished then it helps stability in exchange rates.”
Brekk said achieving the target would create additional space for cutting interest rates during economic downturns. The BOJ is currently taking the right approach toward progressing toward its goal, he said.
Nikkei glances off Long-term resistance.
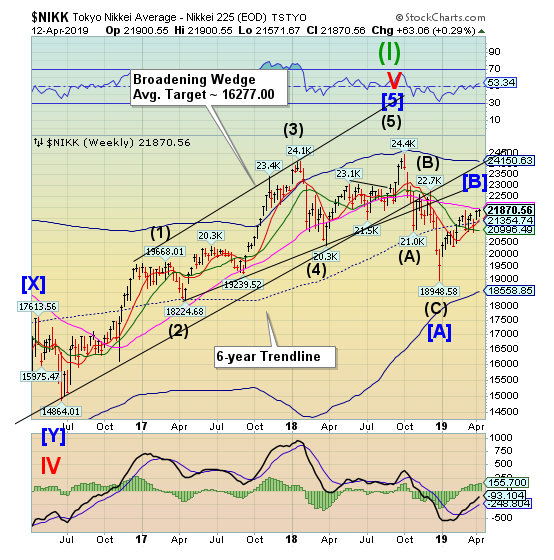
The Nikkei glanced off Long-term resistance at 21918.86 a second time, closing beneath it but rising above the March 4 high at 21860.39. This may indicate maximum resistance which may end the rally. The Nikkei may quickly decline back beneath mid-Cycle support at 21354.74, creating a sell signal.
(Reuters) - Japan’s Nikkei share average inched up to close at a four-month high on Friday, but was little changed for the week, as many investors stayed on the sidelines ahead of the U.S. and domestic earnings season and an upcoming 10-day holiday in Japan.
The benchmark Nikkei closed at 21,870.56, up 159.18 points, or 0.7 percent, its highest level since December 5.
However, the broader market was not as rosy as the Nikkei might suggest, with the Topix index dropping 0.1 percent to 1605.40.
U.S. Dollar resumes its decline.
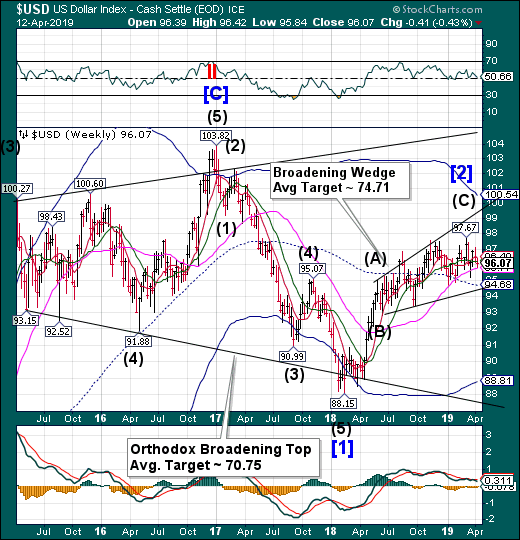
USD resumed its decline, testing Long-term support at 95.77 and closing beneath Intermediate-term support/resistance at 96.16. This gives the USD a sell signal with additional confirmation beneath Long-term support. USD may remain on its decline through the end of April.
(Reuters) - Europe must raise the international profile of its euro currency to protect itself from the domination of a “weaponised” U.S. dollar and help stabilize the international monetary system, the chairman of euro zone finance ministers Mario Centeno said.
“Washington’s inclination to use the dollar as a tool to complement the effect of economic sanctions and serve a narrow domestic agenda is a source of concern,” Centeno told the Reinventing Bretton Woods Committee in Washington on Friday.
“The foundations of the international monetary system are wobbling, as currencies are used to advance national interests that are narrowly defined. For some observers, the system in which the dollar holds a dominant and unrivalled position is on the cusp of reformation,” he said in a speech.
Gold bounces, but remains on a sell signal.
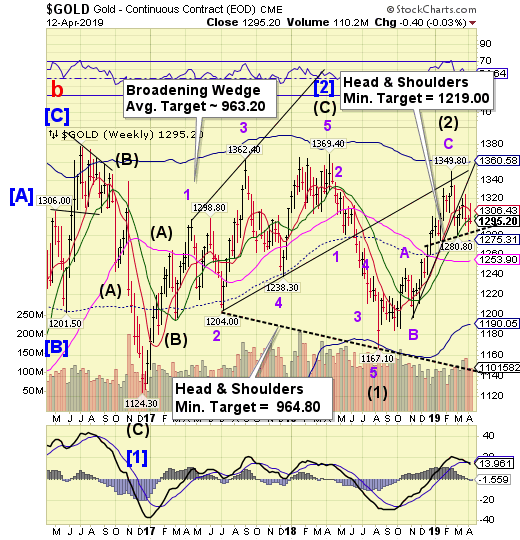
Bounced from the neckline of a Head & Shoulders formation, suggesting the decline may have legs. It is likely that gold may revisit the Cycle Bottom support at 1190.06.The Cycles Model suggests several weeks of decline ahead. The larger Head & Shoulders formation matches targets with the already existent Broadening Wedge formation.
(CNBC) Gold steadied on Friday en route to its first weekly gain in three weeks as the dollar weakened although the metal’s advances were capped by stronger equities.
Spot gold rose 0.2 percent to $1,294.36 per ounce as of 10:20 a.m. The metal broke below $1,300 and hit a one-week low on Thursday, but prices have gained 0.3 percent so far this week.
U.S. gold futures settled $1.90 higher at $1,295.20.“We’re recovering a little bit after yesterday’s big sell-off. The dollar strength really hurt precious metals and we’re seeing some of that reverse with most currencies running a little higher versus the dollar this morning,” said Chris Gaffney, president of world markets at TIAA Bank.
Crude retraces nearly 65% of its losses.
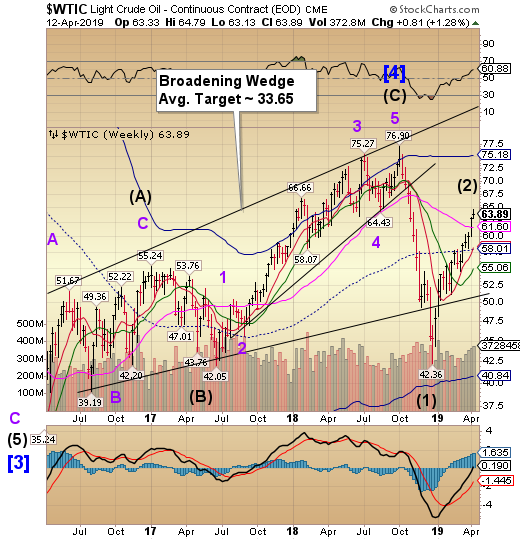
Crude made a new retracement high, retracing nearly 65% of its losses in 2018. However, there appears to be a loss of momentum as the Cycles Model period of strength has dissipated. Excitement among investors is peaking. The reversal is overdue…
(Reuters) - Oil prices rose 1 percent on Friday as involuntary supply cuts from Venezuela and Iran plus conflict in Libya supported perceptions of a tightening crude market, while upbeat Chinese economic data eased concerns about waning crude demand.
The oil market also followed global stock markets higher after strong earnings at JPMorgan Chase & Co. The dollar index slipped to its lowest against the euro in more than two weeks, making crude cheaper for non-U.S. buyers. N USD
“Equities are getting off to a good start with earnings season and the dollar index being weaker helps reaffirm confidence in the oil market,” said Phil Streible, senior commodities strategist at RJO Futures in Chicago.
Shanghai Index makes a key reversal.
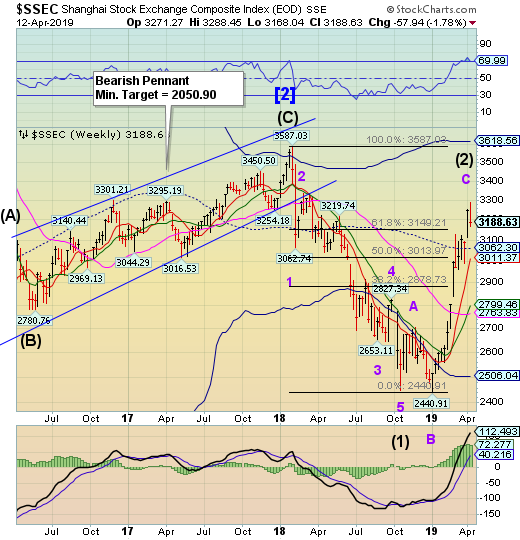
The Shanghai Index rallied to a 74% retracement on Monday but made a Key Reversal for the day. Last week I suggested that,, “ Cyclical strength that may be exhausted over the weekend.”A decline back beneath 3062.30 may give a sell signal that may last up to two months.
(ZeroHedge) One month ago, we asked if that was it for China's "Shanghai Accord 2.0"?Turns out the answer was a resounding "no."
As we noted at the time, one month after the PBOC injected a gargantuan 4.64 trillion yuan ($685 billion) into the economy - more than the GDP of Saudi Arabia - in the month of January in the country's broadest credit measure, the All-System Financing Aggregate a credit injection that was so massive it even prompted the fury of China's prime minister Li Keqiang who lashed out at the central bank for its unprecedented debt generosity in a time when China was still pretending to be on a deleveraging path, in February the PBOC again surprised China-watchers, this time to the downside, when the Chinese central bank reported that aggregate financing increased by a paltry 703 billion yuan, roughly half the expected 1.3 trillion, the lowest print in the revised series history.
The Banking Index stalls at Long-term resistance.
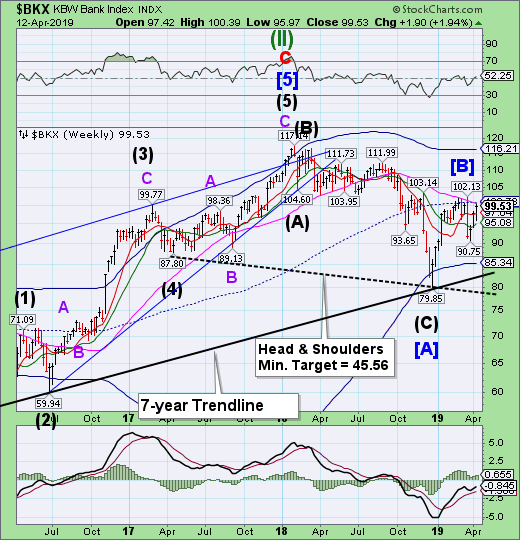
After stalling a Short-term resistance, BKX probed higher, challenging Long-term resistance 100.42, but closed beneath it. The retracement appears to have run out of strength. The Cycles Model suggests a probable 4 weeks of decline.
(Forbes) Earnings season started with a bang early Friday as two major U.S. banks shared Q1 results and the market reacted positively. Big beats from JPMorgan Chase and Wells Fargo (NYSE:WFC) really help set a positive tone for earnings overall.
JPMorgan Chase earned $2.65 a share in the first quarter, easily beating third-party consensus estimates of $2.35. Revenue—which many analysts had expected to decline—rose 5% to $29.9 billion as the company appeared to benefit from higher interest rates and strength in consumer banking. Shares rose more than 2.5% in pre-market trading.
JPMorgan Chase’s Chairman and CEO Jamie Dimon, who swings a lot of influence around Wall Street, gave a sunny report on the U.S. economy in the earnings release, saying, “Even amid some global geopolitical uncertainty, the U.S. economy continues to grow, employment and wages are going up, inflation is moderate, financial markets are healthy and consumer and business confidence remains strong.”
(ZeroHedge) When we reported Wells Fargo's Q1 earnings back in January, we drew readers' attention to one specific line of business, the one we have repeatedly dubbed the bank's "bread and butter", namely mortgage lending, and which as we then reported was "the biggest alarm" because "as a result of rising rates, Wells' residential mortgage applications and pipelines both tumbled, sliding just shy of the post-crisis lows recorded in late 2013."
Well, unfortunately for Wells - which until recently was the largest US mortgage lender - despite the sharp drop in yields in Q1 which many had expected would boost mortgage lending or at least refi activity, the decline in mortgage activity has continued, because buried deep in its presentation accompanying otherwise unremarkable Q1 results (modest revenue and EPS best), Wells just reported that its 'bread and butter' is once again missing, and in Q1 2019 the amount of all-important Wells Fargo Mortgage originations shrank again, dropping to just $33 billion, down $5 billion sequentially, and the lowest level since the financial crisis. Putting this number in context, just six years ago, when the US housing market was actually solid, Wells was originating 4 times as many mortgages, or about $120 billion.
(ZeroHedge) At the same time that major bank CEOs were being questioned by Congress yesterday about their exorbitant pay packages, one of America’s highest paid bank CEOs was likely just having a normal day at the office. Gregory Garrabrants is the head of Axos Financial (formerly the "Bank of Internet" / BOFI), an online lender, who earned a massive $34.5 million in compensation in 2018, eclipsing the sums made by CEOs like David Solomon at Goldman Sachs (NYSE:GS) and Jamie Dimon at JP Morgan.
What makes the pay package stand out even more is the fact that Axos is only a $9.8 billion bank, compared to JP Morgan, which has assets approaching $3 trillion, according to Bloomberg.
