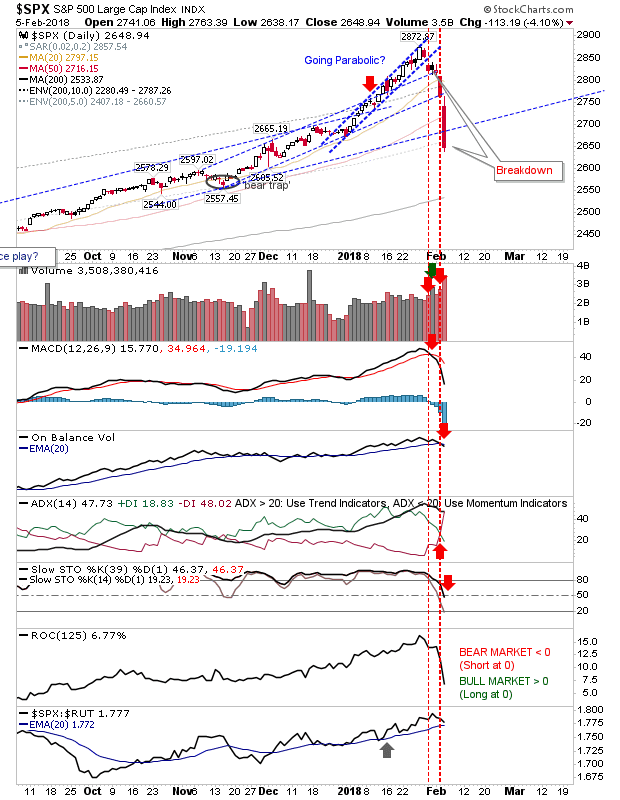
Having spent the weekend away I missed the initial breakdown on Friday but yesterday was a clear rebuttal of the 2018 rally. The past two days have undone all of the gains of this year - undercutting slower channel support for many of the indices.
The S&P climbed to register as distribution with a net bearish turn in technicals. Next downward target is the 200-day MA around 2,530.
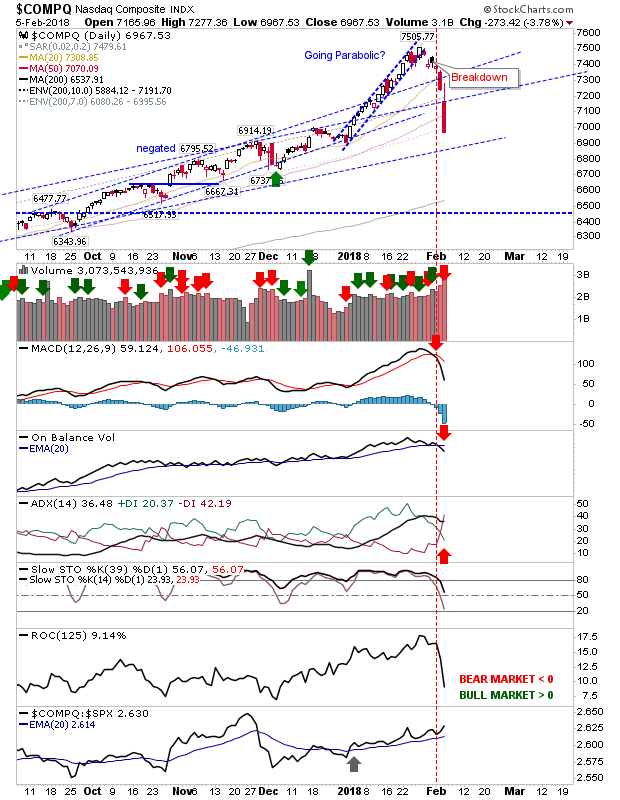
The NASDAQ didn't quite make it all the way to the slower channel line but it did slice through the 50-day MA. Unlike the S&P, technicals are not net bearish but will likely get there today. There wasn't much for bulls to lean on with the index finishing in no man's land.
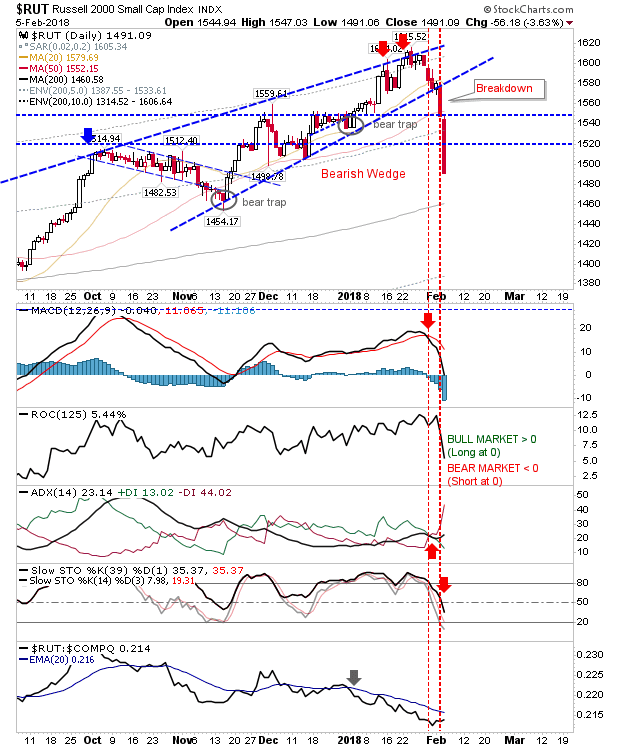
The Russell 2000 had offered itself as the pullback-support buying opportunity when the index traded at bearish wedge support, but buyers didn't take the bait and instead selling accelerated. Technicals finished the day net bearish but ironically, relative performance improved a little. The 200-day MA looks like it will be tested over the coming week.
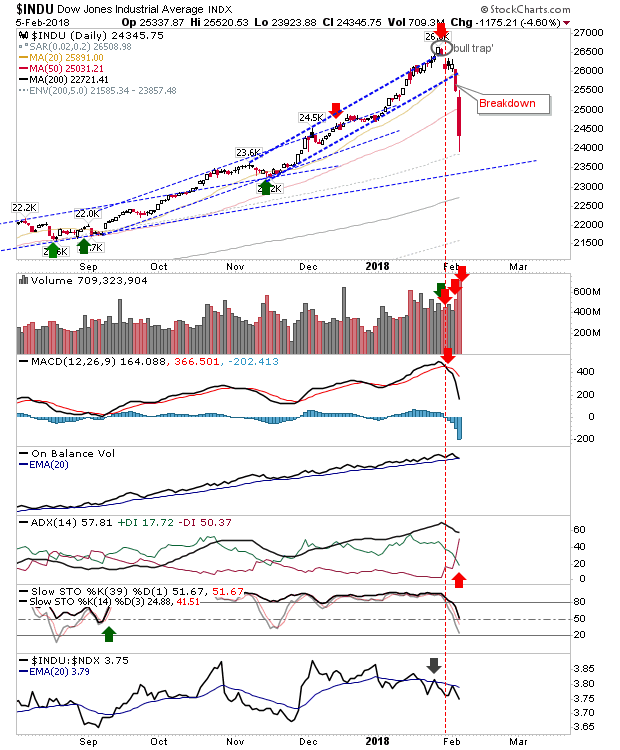
The Dow experienced the heaviest of the selling. Bearish action sliced clean through its 50-day MA as it wiped out weeks of gains in one day. Trading volume was significant.
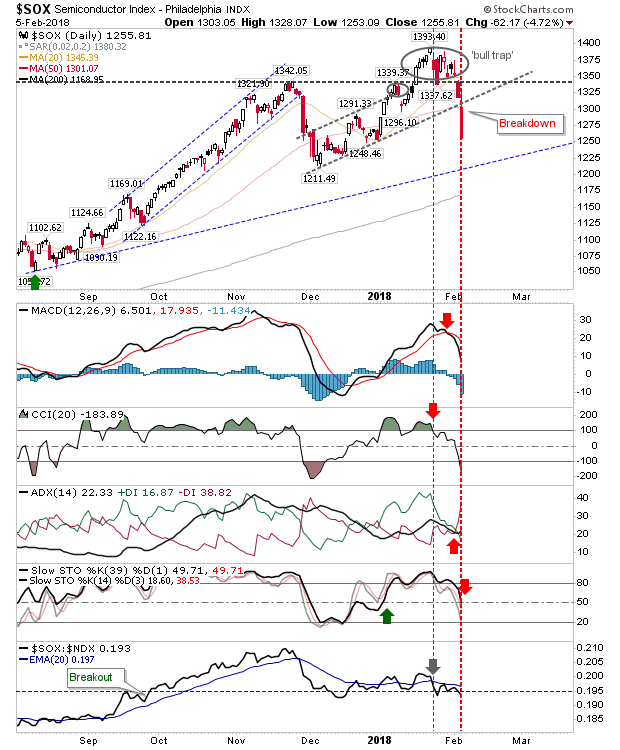
Finally, the Semiconductor Index fulfilled the 'bull trap' by undercutting the prior channel. Relative performance looks vulnerable to a fresh wave of selling which would suggest not even the 200-day MA will hold up as support. Ugly days look to lie ahead - shorts to gain.
Across all markets, Monday's significant losses will open up a chance for relief rallies (and a chance to take profits) but these are likely to fade with 'fat-cat' weak hands looking to get out after months of complacency (triggered by Trump's election rally). The rest of this year is likely to be spent consolidating gains so it will a question of establishing the boundaries of these ranges rather than a straight up - straight down.
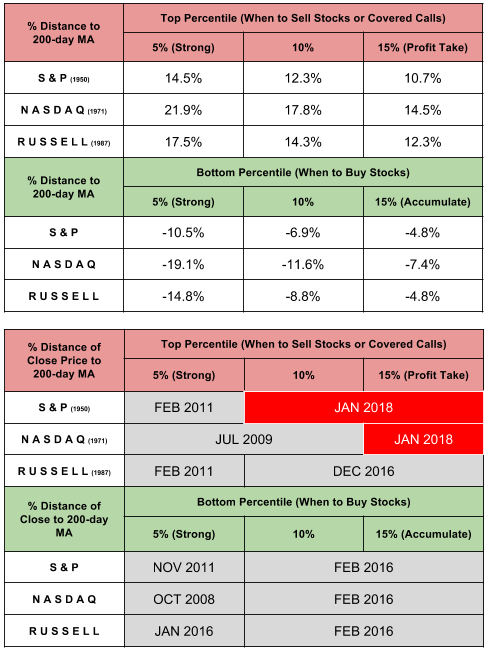
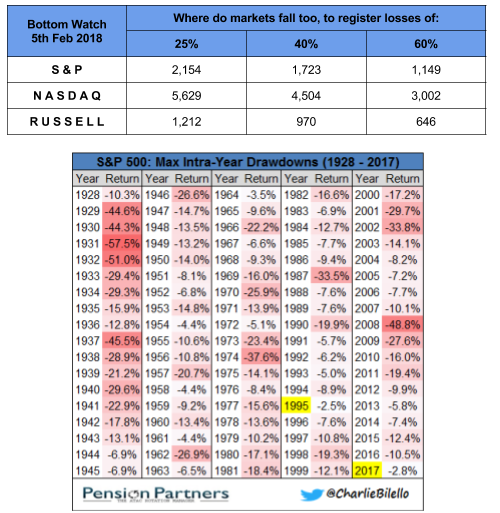
In the Bottom Watch table (below) I have updated the 'what if?' scenario for a 25%, 40% and 60% loss. Even in a worst case scenario (a 60% loss) markets would be left trading at levels last seen in 2013 - 4 years after the market bottom. It's clear 2009 marks a generational low and any significant sell-off should be viewed as a buying/accumulation opportunity. Those who heeded my top watch to sell in January 2018 (also in the tables below) need only need wait until the corresponding 'buy' opportunities appear; last of which was in February 2016.
