🥇 First rule of investing? Know when to save! Up to 55% off InvestingPro before BLACK FRIDAYCLAIM SALE

Media Signaling Market Implosion But 7 Charts Prove Otherwise

Published 01/26/2017, 06:14 AM
Updated 07/09/2023, 06:31 AM
NDX
-
US500
-
DJI
-
IXIC
-
VIX
-
MIWOU0000PUS
-

Despite some TV and media pundit and investor rhetoric about the imminent implosion of the U.S. markets under President Trump's economic agenda (in the months leading up to the November 8, 2016 Presidential election and, still, to date), we continue to see new market all-time highs being made, along with stabilization and advancement of world markets, in general, since the election.

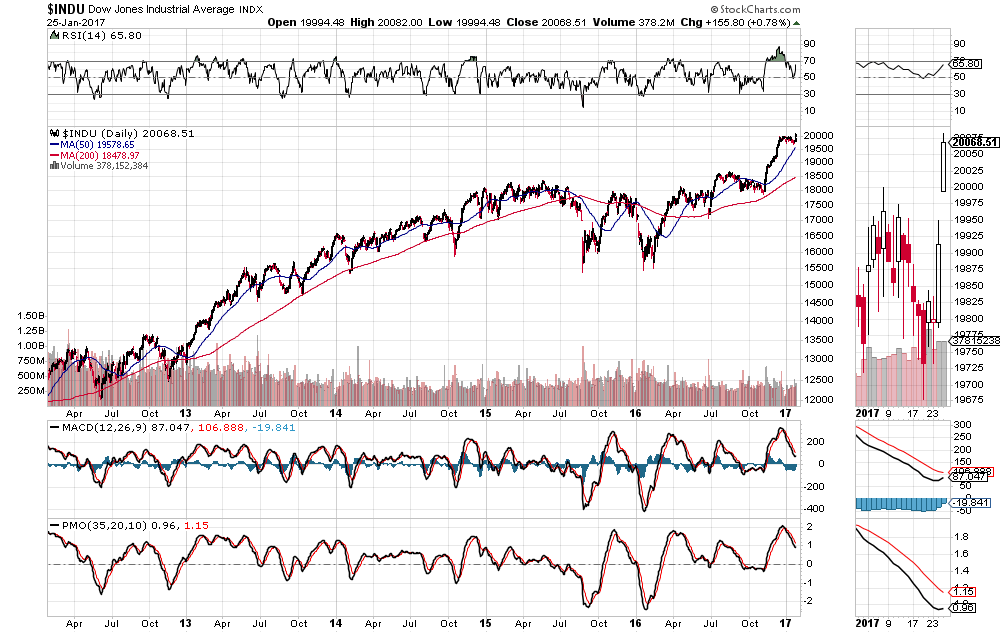
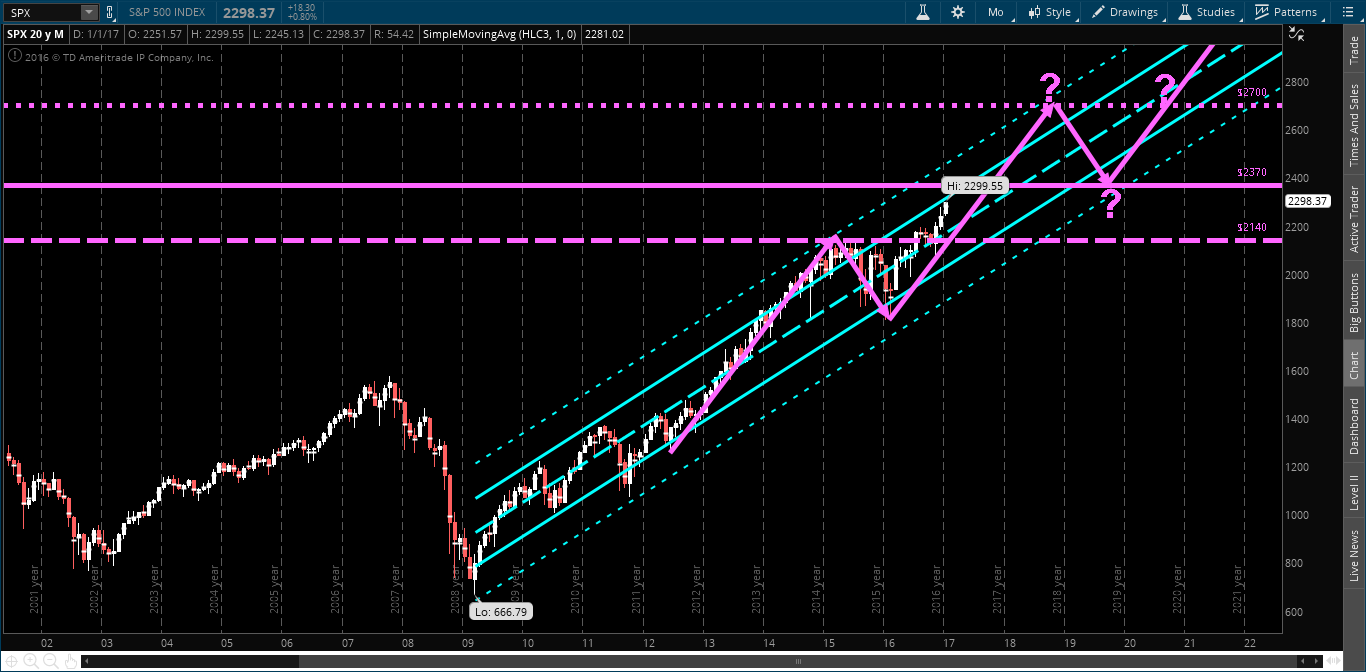
The following charts illustrate that point. For example, the Dow 30 Index finally broke and closed above 20,000 on Wednesday, while the S&P 500 Index remains on track to, potentially, achieve the 2400 level by the end of 2017 (as described in my post of December 1, 2016), and closed at an all-time high of 2298.37 yesterday.

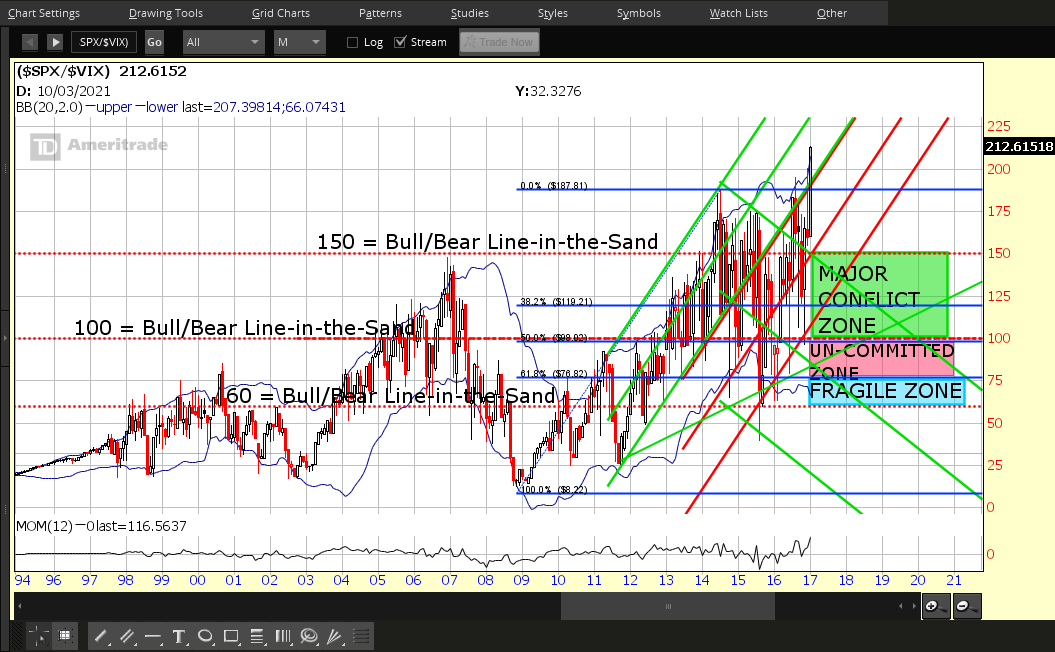
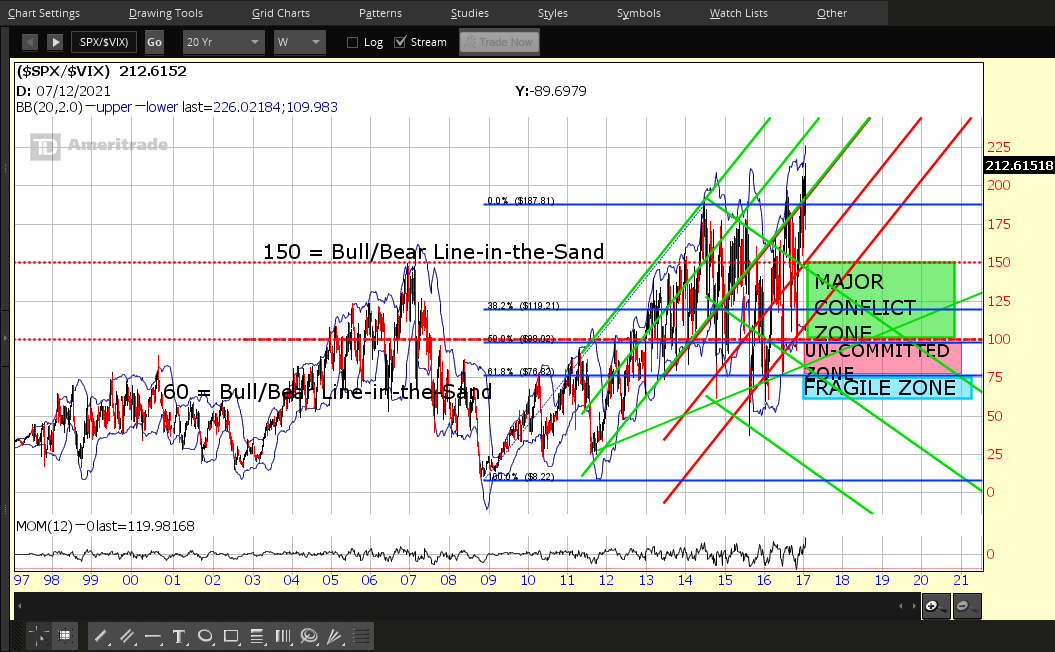
As well, the SPX:VIX ratio also closed at an all-time high Wednesday, with the momentum indicator confirming longer and short-term bullish sentiment in the SPX, as shown on the monthly and weekly timeframes (which I mentioned as something to monitor in my post of December 31, 2016).

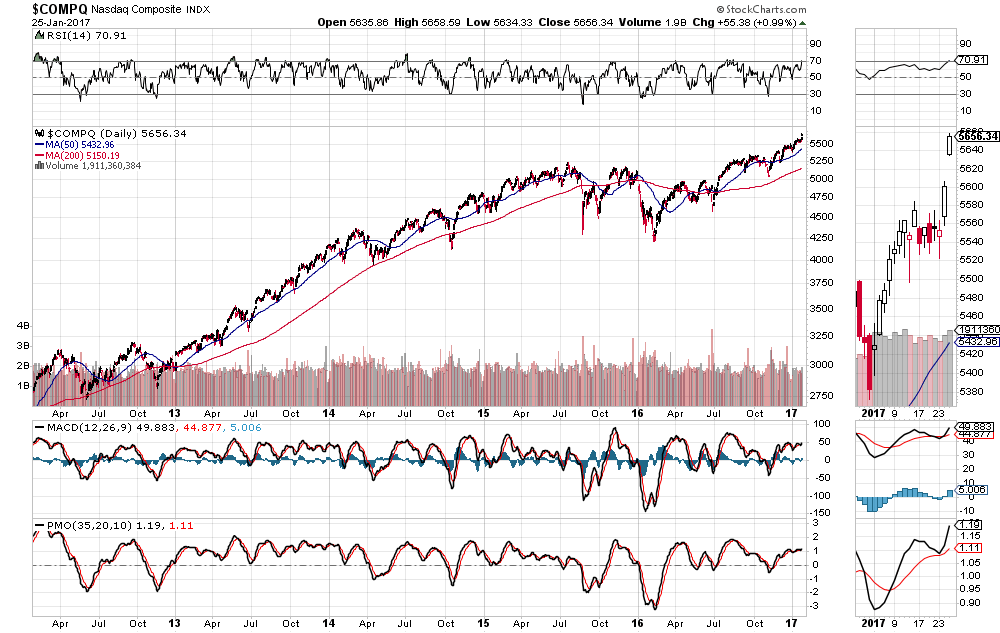
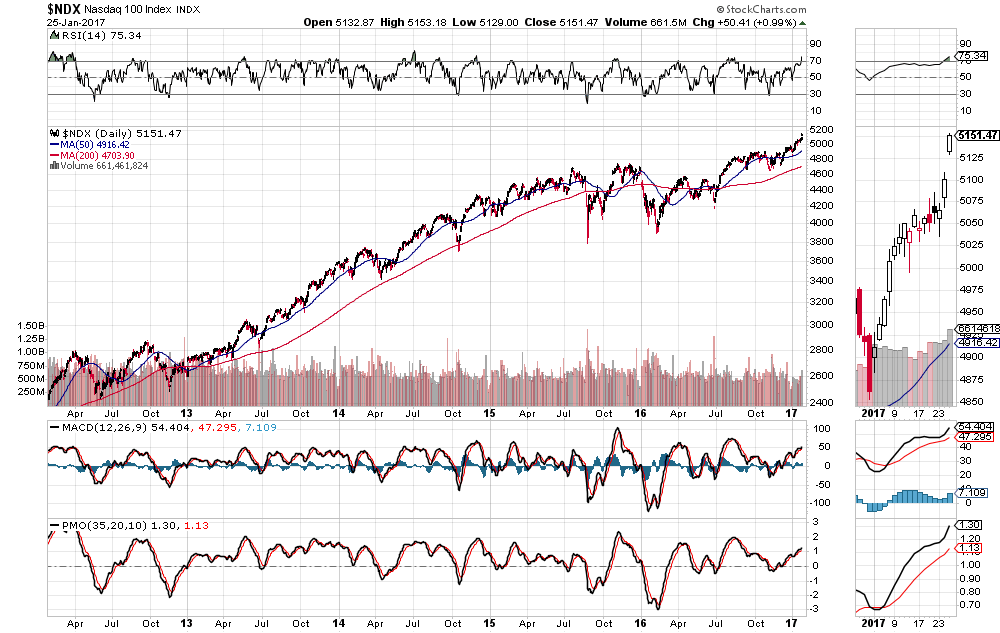
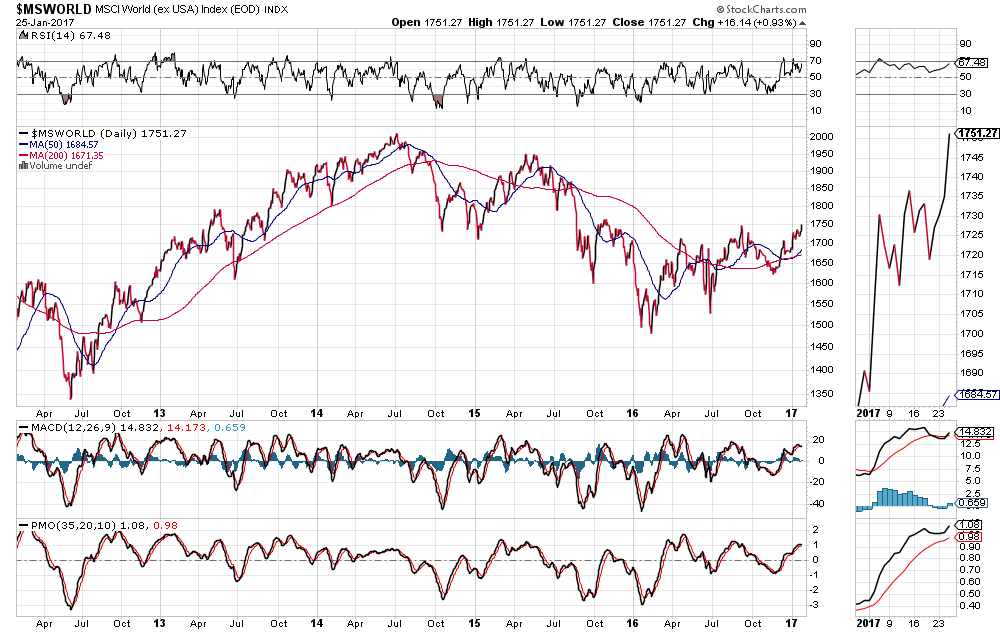
The NASDAQ Composite Index and the NASDAQ 100 Index both closed at all-time highs on Wednesday. Even the World Market Index, after its latest and current rally produced another moving average Golden Cross formation in mid-January of this year, shows that foreign markets are also under such bullish influence.

So, while a healthy divergence of pundit/investor viewpoints will, no doubt, continue, it may be wise to consider what the charts are portraying, as part of your "due diligence" trading/investing process. At the moment, momentum is favouring the bulls and will do so, until these charts prove otherwise.
INDU Daily Chart
SPX Monthly Chart: 20-Years
SPX:VIX Ratio: Daily Chart
SPX:VIX Ratio Chart
NASDAQ Composite Daily Chart
NASDAQ 100 Daily Chart

MSCI World Ex US Daily Chart

Latest comments

Loading next article…
Risk Disclosure: Trading in financial instruments and/or cryptocurrencies involves high risks including the risk of losing some, or all, of your investment amount, and may not be suitable for all investors. Prices of cryptocurrencies are extremely volatile and may be affected by external factors such as financial, regulatory or political events. Trading on margin increases the financial risks.
Before deciding to trade in financial instrument or cryptocurrencies you should be fully informed of the risks and costs associated with trading the financial markets, carefully consider your investment objectives, level of experience, and risk appetite, and seek professional advice where needed.
Fusion Media would like to remind you that the data contained in this website is not necessarily real-time nor accurate. The data and prices on the website are not necessarily provided by any market or exchange, but may be provided by market makers, and so prices may not be accurate and may differ from the actual price at any given market, meaning prices are indicative and not appropriate for trading purposes. Fusion Media and any provider of the data contained in this website will not accept liability for any loss or damage as a result of your trading, or your reliance on the information contained within this website.
It is prohibited to use, store, reproduce, display, modify, transmit or distribute the data contained in this website without the explicit prior written permission of Fusion Media and/or the data provider. All intellectual property rights are reserved by the providers and/or the exchange providing the data contained in this website.
Fusion Media may be compensated by the advertisers that appear on the website, based on your interaction with the advertisements or advertisers.
© 2007-2024 - Fusion Media Limited. All Rights Reserved.