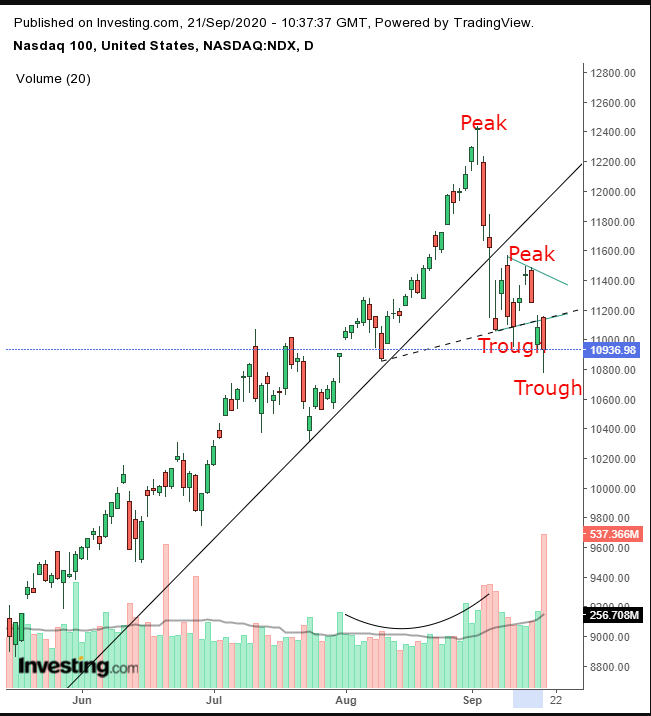
The US technology sector selloff continued into Friday’s close, pressuring the broader market and taking the NASDAQ to more than a six-week low.
Even though the tech sector makes up less than 30% of the S&P 500, the index closed lower for the third straight week, largely because of the tech stocks' significant and disproportionate influence on the broader benchmark.
On the other hand, cyclical shares—stocks of companies that go up and down according to the business cycle such as oil producers and small caps—gained for the week.
Is this selloff a healthy correction, necessary so the market can achieve new heights, or is it a more ominous reversal?
Remember that after the March stock collapse, equities rapidly rebounded (with some help from the Fed's dovish policies), exploding higher by 60% from late March to early September. Tech stocks led the gains, jumping a mind-boggling 80% in less than six months.
Yet more breathtaking, the big five mega cap tech firms—Apple (NASDAQ:AAPL), Microsoft (NASDAQ:MSFT), Alphabet (NASDAQ:GOOGL), Amazon (NASDAQ:AMZN) and Facebook (NASDAQ:FB) added an incredible 91% of value over the same period.
However, investor exuberance on the tech sector appears to be over now.
Last week, we said the NASDAQ 100 was sitting on a knife’s edge. That's no longer the case.
The tech-heavy index has completed a reversal. As such, we're now making a bearish call.

The index just completed a pennant, bearish after its more than 11% freefall within four sessions from the Sept. 2, all-time high. This is considered a continuation pattern after the early bears cashed out with exceptional winnings and new bears are coming in for the trade.
When the price falls through the pennant’s floor it demonstrates that whoever wanted to buy back shorts has already done so, which means short sellers must now seek new buyers at lower prices.
At the same time as the downside breakout of the bearish pennant, the price registered a second lower trough. After two descending peaks, we officially have ourselves a downtrend.
We might even have a H&S top, with the dotted line serving as the neckline. Note, a serious H&S runs at least three months, while this one is only one month long. Nevertheless, the volume supports the dynamics of a H&S top, as participation dried up with the rallies and spiked with the selloffs, pointing out where the interest is. Finally, on Friday, the index fell with the highest volume since the December 2018 selloff.
Trading Strategies
Conservative traders would wait for another selloff before the July lows are hit, to establish two peaks and troughs within a downtrend, independent of the price action within the preceding uptrend.
Moderate traders would wait for a return move, at least for a better entry if not for confirmation of the trend, with further resistance by the pattern.
Aggressive traders may short at will, provided they understand and accept the risk of stocks whipsawing in this unusual market environment and have a carefully prepared a trading plan they are committing to stick to. Here’s an example:
Trade Sample
Entry: 11,100 – upon a return move
Stop-Loss: 11,200
Risk: 100 points
Target: 10,400 – July lows
Reward: 700 points
Risk:Reward Ratio: 1:7
Author's Note: This is just a sample, not the lesson. It is not necessarily the only correct way to approach this trade. Everyone trades differently, based on budget, timing and temperament.
