US futures are up, and as of the time of writing, NASDAQ Futures are up the most. Contracts on the NASDAQ 100 are adding 1.6% of value, outperforming the other major US futures.
After last week's first back-to-back weekly decline since April, buyers have returned US equity markets, and tech shares with newfound optimism. Is this a buy-the-dip opportunity, or the start of another phase for Wall Street shares, one that could be heading lower?
Today's robust move higher could be based on optimism fueled by Pfizer's (NYSE:PFE) CEO who late last week said the pharma giant's coronavirus vaccine, which is currently in late-stage trials, could be rolled out to Americans by the end of the year. As well, market analysts remain optimistic about US stocks, believing they just went through a statistical correction.
We’re not so sure. Fundamentally, there are two primary geopolitical factors currently moving the markets: the pandemic and a brewing cold war between the US and China.
Regarding the first point, we still don’t have a vaccine. And when one finally emerges, there's an argument being made that it would be logistically impossible to send it to most of the world.
As for the second point, there are too many elements keeping the relationship between the two largest global economies tense—uncertainties about Oracle's (NYSE:ORCL) newly minted partnership with ByteDance's TikTok for its US operations, which could still be scuttled by President Donald Trump, as well as additional as yet unforeseen trade and global supply chain mishaps that could emerge.
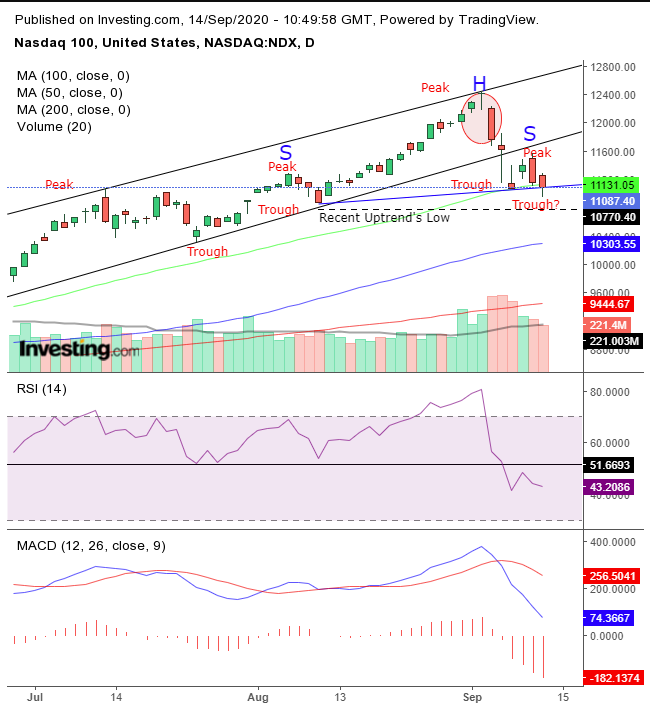
Technically, the tech index's uptrend has been put to a serious test.

The first signal of a reversal was the powerful Evening Star, whose final candle erased five days worth of gains, on the highest volume since June.
The second indicator occurred when prices fell below their rising channel since the March lows. The third sign was triggered when the price attempted a push higher, but fell away from the bottom of the rising channel, and the fourth red flag emerged when the price established a descending series of peaks and troughs. The fifth and final signal sounded an alarm when the pattern completed a H&S top.
As well, there are two reasons we’re not making a bearish call just yet:
First, the price has yet to fall below the final low within the uptrend, registered on Aug. 11 at 10,855.06.
Second, although the completed H&S top was textbook perfect, the penetration was only 1.3% and then only on an intraday basis. Bulls managed to push the price back above the neckline before the close, showing there was still life left in the rally.
In this historically unsettled environment, we expect the price to slip in and out of patterns. So, we’re giving the price extra leeway. Plus, we can't make any calls about when the next leg of bearish trader sentiment might be triggered.
While the RSI and the MACD are breaking down, showing the trend weakening from both a momentum perspective, as well as a broad array of pricing perspectives. We want to be cautious.
As such, we're waiting for the final two pieces of the evidence-puzzle to fall into place:
- A decisive downside breakout of the H&S top,
- Along with a low that takes out the last one within the uptrend.
When both those things happen, we'll resume our bearish stance. For now, as far as we know, investors will run prices back up to retest the record.
Trading Strategies
Conservative traders would wait for a minimum filter of 3%, down to 10,750, and a 3-day period, preferably to include a weekend, to reduce the odds of a bear trap. Then, they’d wait for the price to retest the pattern, showing evidence that supply has taken over.
Moderate traders, who would normally be content with a 2%, 2-day filter, should wait for the same 3%, so that it would clear the Aug. 11 low. Then, like their conservative peers, they’d wait for a return-move, for a better entry, if not for additional evidence.
Aggressive traders may enter a contrarian, long position, counting on a bounce in this volatile environment, as long as they understand the risk and can withstand the potential loss. Money management is crucial. Here’s an example:
Trade Sample – Aggressive Long
- Entry: 11,000 – upon a dip
- Stop-Loss: 10,900
- Risk: 100 points
- Target: 11,500
- Reward: 500 points
- Risk:Reward Ratio: 1:5
Author's Note: This is an aggressive trade, suitable only for traders who can handle the monetary risk and emotional upheavals that are likely to be part of such a trade. If you can’t handle this trade, wait for the triggers as described in the section that indicates your risk-tolerance level. This trade is not necessarily the one correct way to make the trade. For example, you can halve the stop-loss to double the relative reward, but that could doubling the risk of being stopped out. You need to develop a style that suits your timing, budget and temperament.
