Channel Resistance Tags For S&P, NASDAQ and NASDAQ 100

Published 01/10/2018, 12:04 AM
Updated 07/09/2023, 06:31 AM
NDX
-
US500
-
US2000
-
IXIC
-
SOX
-

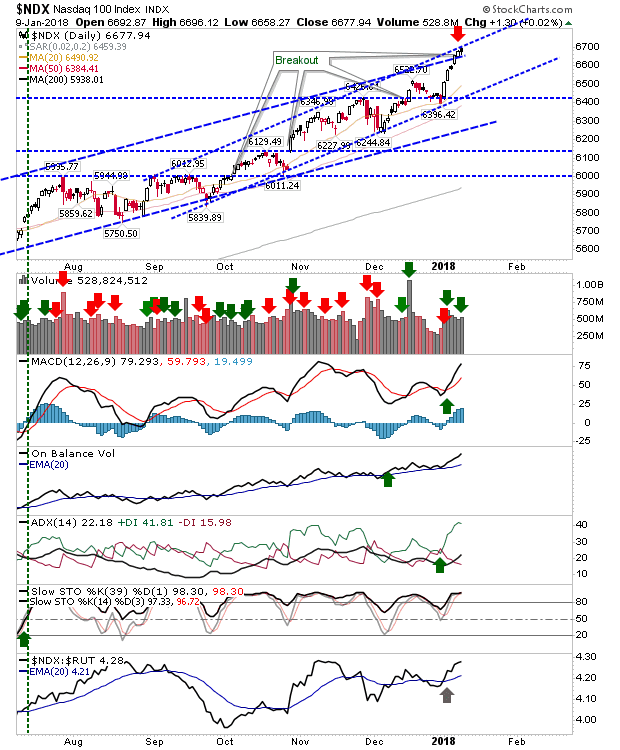
Since redrawing channel resistance the S&P, NASDAQ and NASDAQ 100 now find themselves up against (accelerated) channel resistance. This may be viewed as an opportunity to take (partial) profits and/or sell covered calls.

Buying volume yesterday for the S&P was modest and technicals remain strong but some pause in the buying would look preferable at this point.
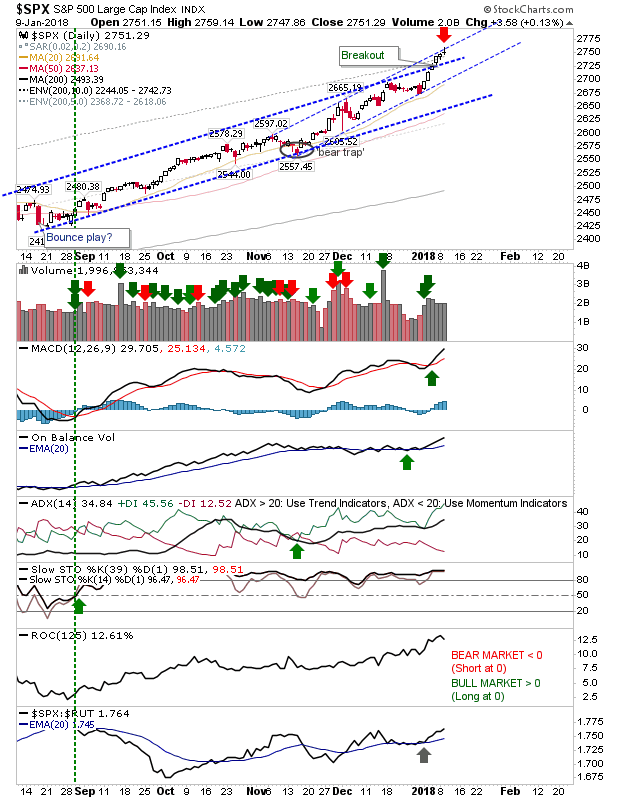
SPX Daily Chart


The NASDAQ and NASDAQ 100 were a little more bearish given they both finished with bearish black candlesticks on higher volume 'selling'. Again, with the channel acceleration in play and a six-day sequence of gains, some profit taking would appear favored.
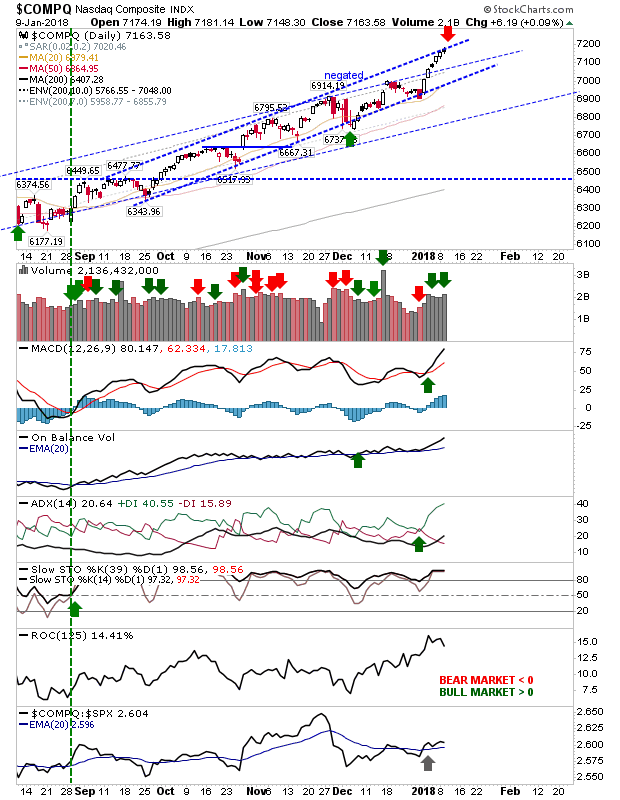
COMPQ Daily Chart

NDX Daily Chart


The Semiconductor Index popped its head above the 'bear flag' but the breakout looks to have failed. Shorts with a stop above 1,340 are looking like a good trade here. Technicals are firm although the index is again underperforming against the NASDAQ.
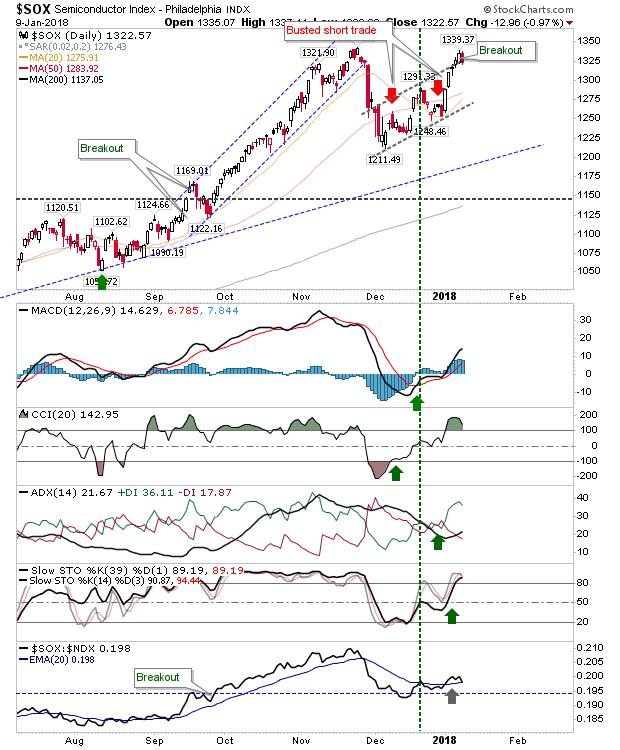
SOX Daily Chart

The Russell 2000 was the most boring of the indices. It has yet to kick on from its breakout - trading within its broader channel and has suffered a large relative loss in performance. This index sits in neutral territory; a drop below 1,545 would kill the nascent breakout and in itself open up a shorting opportunity.
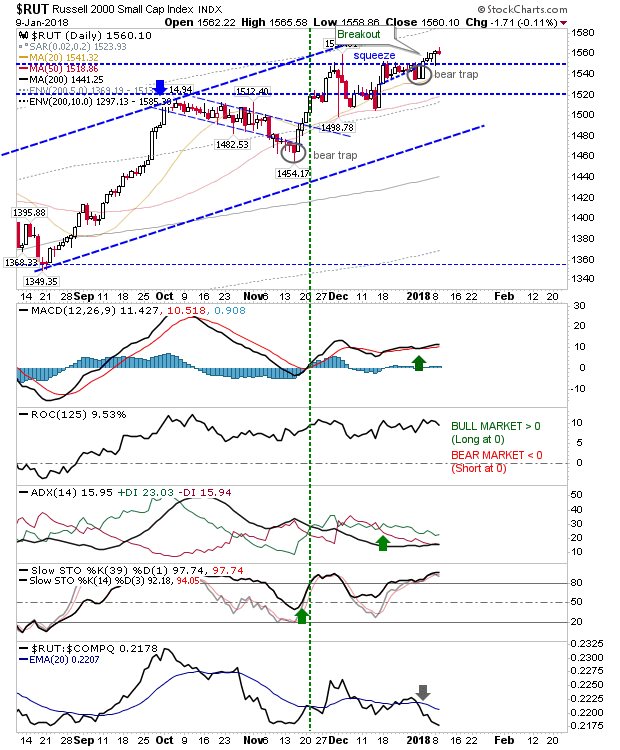
RUT Daily Chart


For today, watch for a retreat from channel resistance for Tech and Large Cap indices.

Latest comments

Loading next article…
Risk Disclosure: Trading in financial instruments and/or cryptocurrencies involves high risks including the risk of losing some, or all, of your investment amount, and may not be suitable for all investors. Prices of cryptocurrencies are extremely volatile and may be affected by external factors such as financial, regulatory or political events. Trading on margin increases the financial risks.
Before deciding to trade in financial instrument or cryptocurrencies you should be fully informed of the risks and costs associated with trading the financial markets, carefully consider your investment objectives, level of experience, and risk appetite, and seek professional advice where needed.
Fusion Media would like to remind you that the data contained in this website is not necessarily real-time nor accurate. The data and prices on the website are not necessarily provided by any market or exchange, but may be provided by market makers, and so prices may not be accurate and may differ from the actual price at any given market, meaning prices are indicative and not appropriate for trading purposes. Fusion Media and any provider of the data contained in this website will not accept liability for any loss or damage as a result of your trading, or your reliance on the information contained within this website.
It is prohibited to use, store, reproduce, display, modify, transmit or distribute the data contained in this website without the explicit prior written permission of Fusion Media and/or the data provider. All intellectual property rights are reserved by the providers and/or the exchange providing the data contained in this website.
Fusion Media may be compensated by the advertisers that appear on the website, based on your interaction with the advertisements or advertisers.
© 2007-2025 - Fusion Media Limited. All Rights Reserved.