Can 200-Day MAs Save Large Caps?

Published 03/26/2018, 12:15 AM
Updated 07/09/2023, 06:31 AM
NDX
-
US500
-
DJI
-
US2000
-
IXIC
-
VIX
-
VXN
-

Thursday and Friday left no doubt as to which side had control of the market. Rallies are now likely to be sold into, given the distance from highs. At this stage, the tone for November's mid-terms has likely been set with January highs unlikely to be tested prior to the elections.

However, it's not all bad news for longs. The S&P finished last week right on its 200-day MA. The likelihood is there will be some follow-through lower but if buyers can bid this back up to the close of business (creating a doji or 'bullish hammer') then there is a good chance for a swing low. The best example is the S&P.
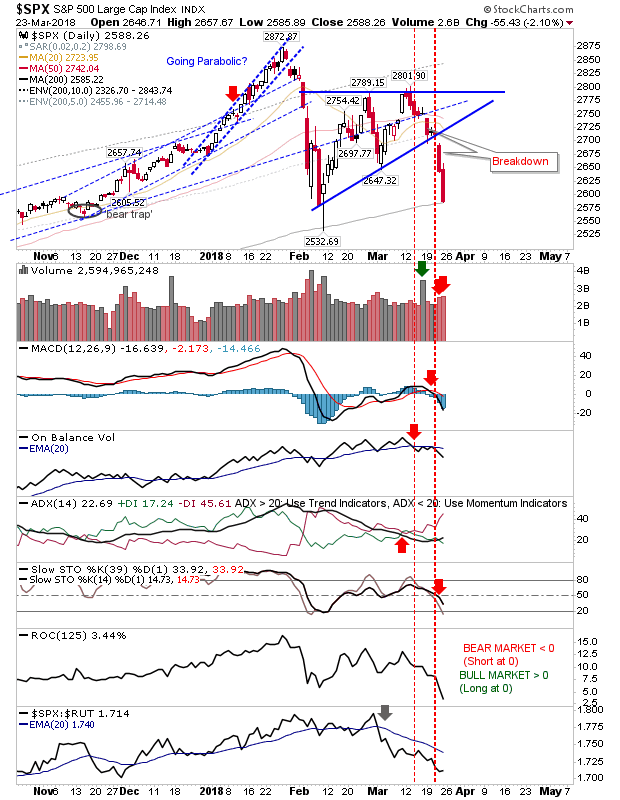
SPX Daily Chart


The Dow Jones Industrial Average average finished very close to its 200-day MA but hasn't yet rolled in. Ironically, weakness in this average has converted to a relative performance advantage against the NASDAQ 100.
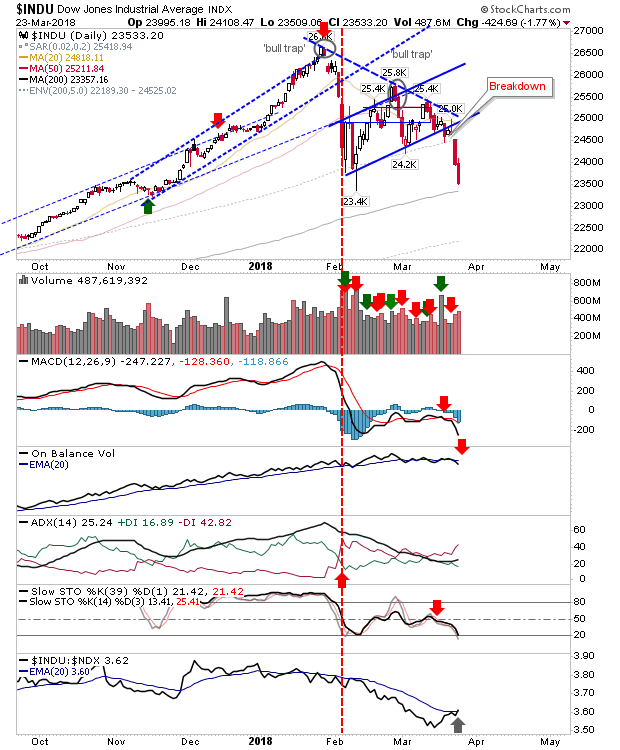
INDU Daily Chart


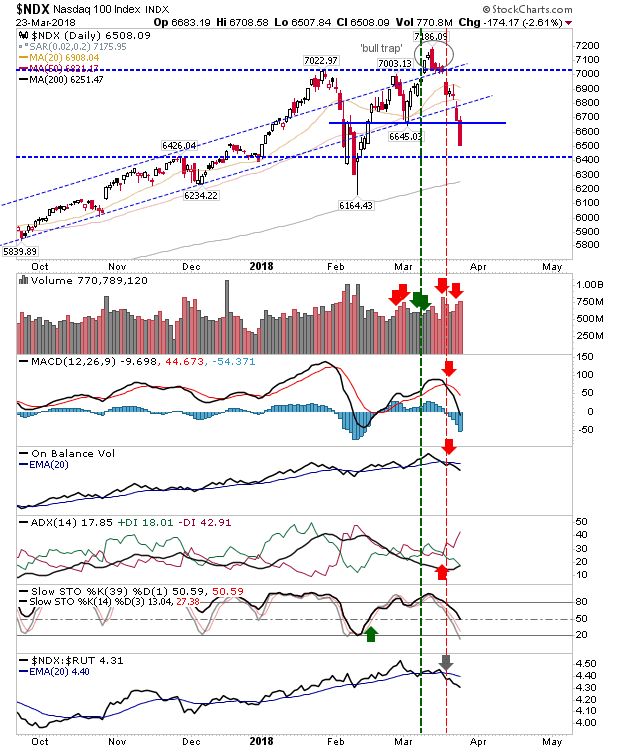
The NASDAQ and NASDAQ 100 cut below their respective March swing lows, leaving the February spike low and the 200-day MA as next targets.
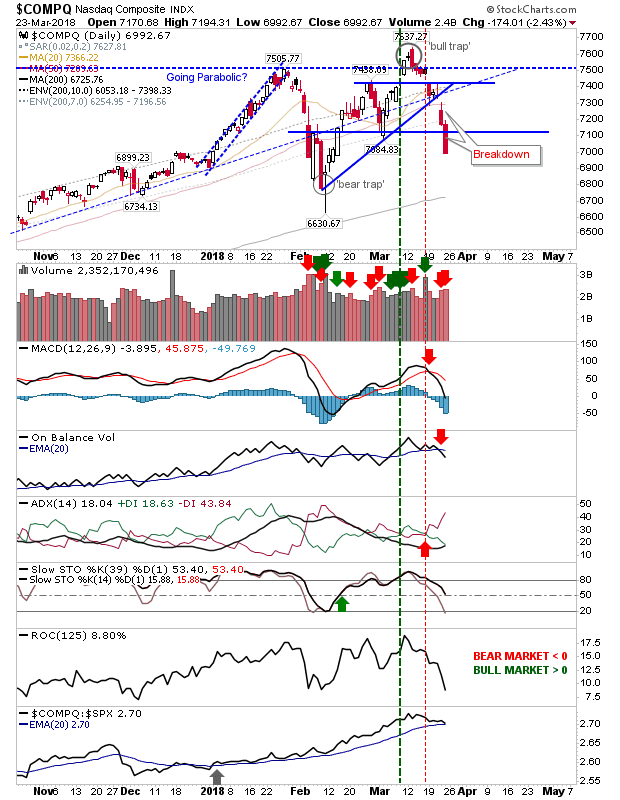
COMPQ Daily Chart

NDX Daily Chart


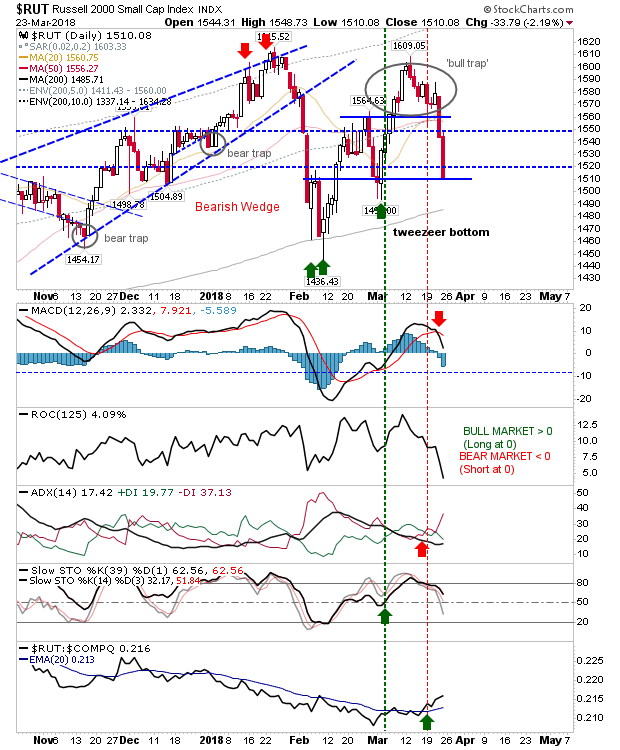
While Tech averages lost March swing lows, the Russell 2000 finished Friday bang on its March swing low. The March tweezer low may still hold but I would expect a test today, Monday, and the 200-day MA may be tested along with it.
RUT Daily Chart


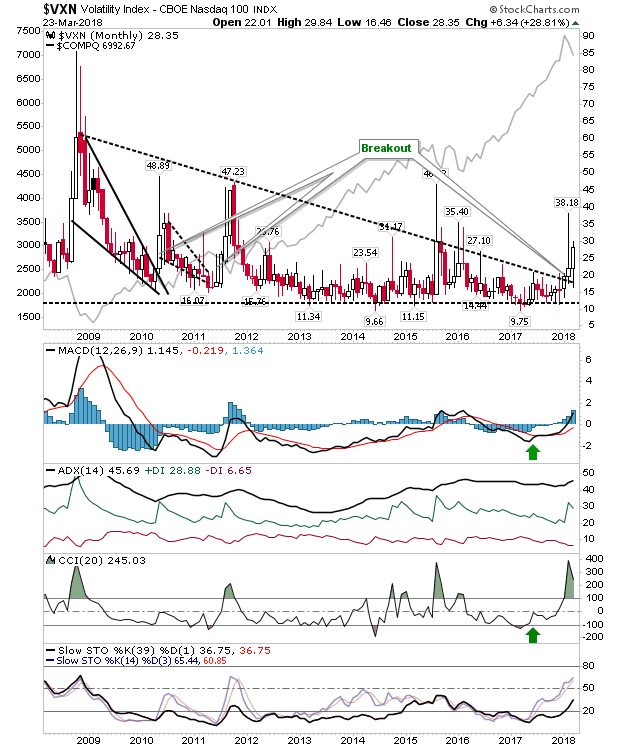
The Volatility Index is picking up a head of steam. With just a few days left in the month there is a steady build-up in volatility yet plenty of room to go before it reaches levels associated with prior tops. After an extended period of weakness we may be looking at a shift back towards higher volatility.

With Trump in power it's not hard to believe uncertainty is taking over the market but a major crash here is unlikely to undo much of the 2009-18 rally.
VXN Monthly Chart


For Monday, look for long opportunities in the S&P, Dow Jones and Russell 2000. Shorts can tighten stops or monitor for additional losses.

Latest comments

Loading next article…
Risk Disclosure: Trading in financial instruments and/or cryptocurrencies involves high risks including the risk of losing some, or all, of your investment amount, and may not be suitable for all investors. Prices of cryptocurrencies are extremely volatile and may be affected by external factors such as financial, regulatory or political events. Trading on margin increases the financial risks.
Before deciding to trade in financial instrument or cryptocurrencies you should be fully informed of the risks and costs associated with trading the financial markets, carefully consider your investment objectives, level of experience, and risk appetite, and seek professional advice where needed.
Fusion Media would like to remind you that the data contained in this website is not necessarily real-time nor accurate. The data and prices on the website are not necessarily provided by any market or exchange, but may be provided by market makers, and so prices may not be accurate and may differ from the actual price at any given market, meaning prices are indicative and not appropriate for trading purposes. Fusion Media and any provider of the data contained in this website will not accept liability for any loss or damage as a result of your trading, or your reliance on the information contained within this website.
It is prohibited to use, store, reproduce, display, modify, transmit or distribute the data contained in this website without the explicit prior written permission of Fusion Media and/or the data provider. All intellectual property rights are reserved by the providers and/or the exchange providing the data contained in this website.
Fusion Media may be compensated by the advertisers that appear on the website, based on your interaction with the advertisements or advertisers.
© 2007-2025 - Fusion Media Limited. All Rights Reserved.