Trend Model signal summary
Trend Model signal: Neutral
Trading model: Bearish
The Trend Model is an asset allocation model which applies trend following principles based on the inputs of global stock and commodity price. In essence, it seeks to answer the question, "Is the trend in the global economy expansion (bullish) or contraction (bearish)?"
My inner trader uses the trading model component of the Trend Model seeks to answer the question, "Is the trend getting better (bullish) or worse (bearish)?" The history of actual (not backtested) signals of the trading model are shown by the arrows in the chart below. In addition, I have a trading account which uses the signals of the Trend Model. The last report card of that account can be found here.
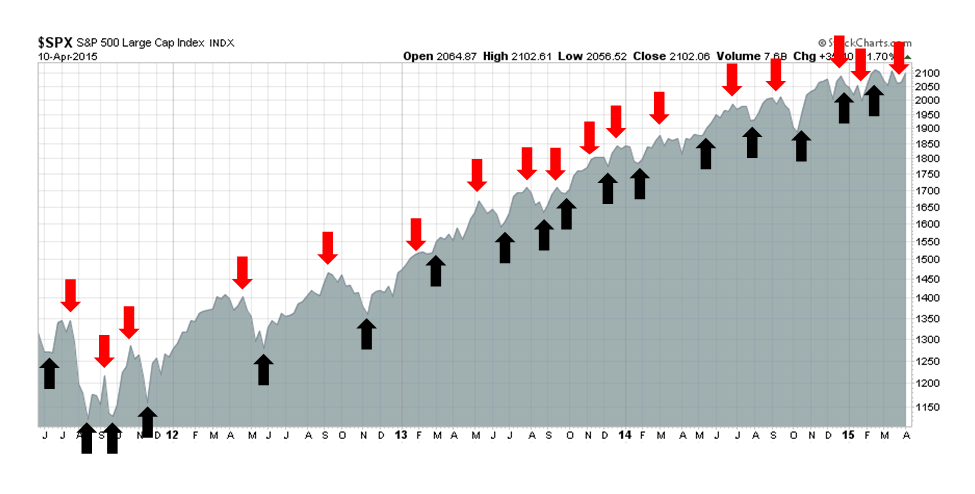
Update schedule: I generally update Trend Model readings on weekends and tweet any changes during the week at @humblestudent.
Market rally, or more chop ahead?
I suppose that with the rally in risky assets, the trading model should get upgraded to bullish from bearish. In the US, the SPX has recovered and exceeded its 50 day moving average (dma). European bourses have strengthened and Asian markets, led by Shanghai and Hong Kong, have been on fire. These are the classic signs of a global bull trend.
I remain skeptical. Recent experience has shown that US equity prices has shown the tendency to reverse themselves. As the chart below shows, the market has done the stutter-step and crossed the 50 dma, which is a reasonable proxy for a medium term trend, a total of 13 times in 2015, compared to only four times in the same period in 2014.
By last Friday, the market was either overbought or mildly overbought on the 5 and 14 day RSI (top two panels) and at levels where rallies have petered out. At the same time, the VIX Index, which tends to be inversely correlated to the market, is now testing a key support level where it has stopped declining in the past.
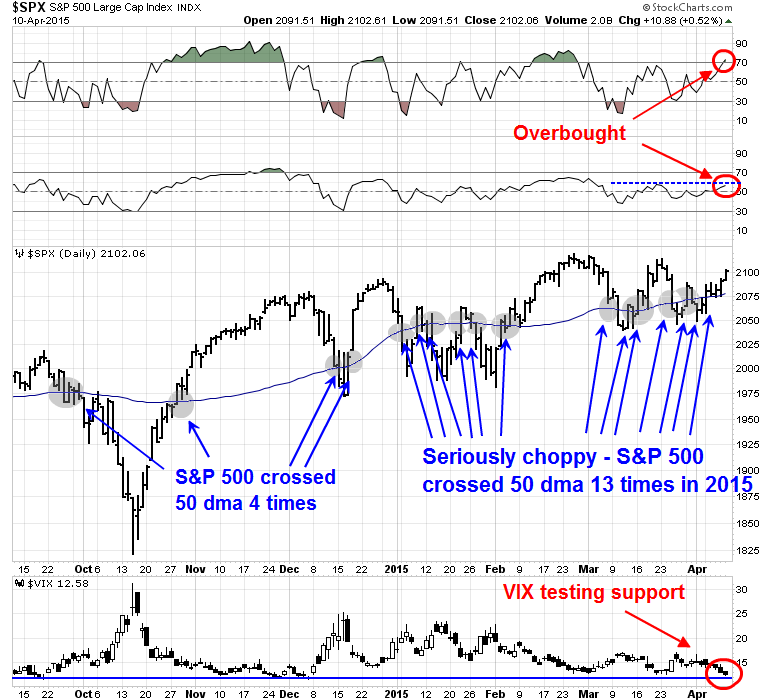
Will the bulls be successful in pushing price up to test the old highs, or will the market roll over as it has done for most of this year? Despite the bullish technical and fundamentals underpinning this latest move, I am leaning towards the latter scenario, where the market falls to the bottom of the trading range.
Possible regime change = Intermediate term top
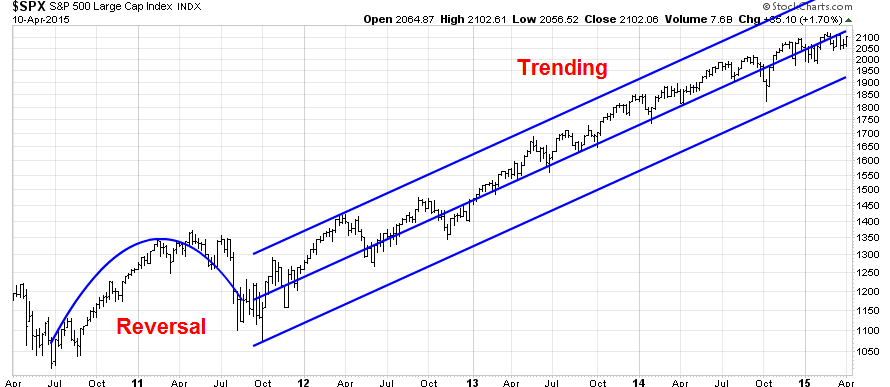
Let me explain why. I wrote about a possible change in the technical market regime in my last post (see 3 secrets from the Book of (Trend Following) Revelations). I referenced a study by James Paulsen of Wells Capital Management, where he showed that the long-term trend was getting a little too good and therefore investors were getting a little too complacent. To recap, the Paulsen study showed that US stocks have been going up more or less in a straight line since 2012, with few drawdowns. By contrast, 2011 saw a reversal of the upward price trend from the 2009 bottom, as it grappled with both an impasse in Washington and a eurozone crisis.
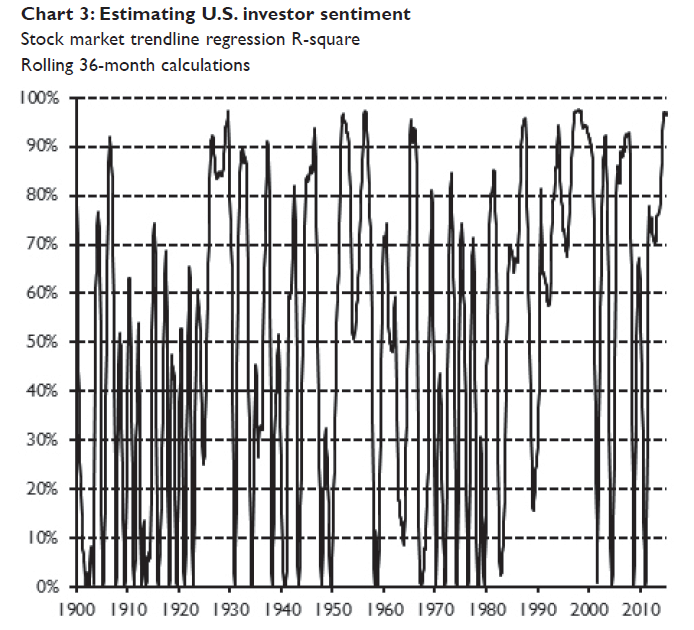
Paulsen went on to calculate the rolling 3-year R-squared, which measures the fit of a trend-line, of the market and showed how it had up and down cycles. When the fit is too good, it can breed investor complacency and the stock prices ultimately reverse themselves. In other words, we may be on the verge of an intermediate term top.
I was sufficiently intrigued by the Paulsen study that I downloaded month-end SPX prices going back to 1950 from Yahoo Finance to reproduced the results and add some of my own insights. As the top panel of the chart below shows, the rolling 36-month R-squared reached an astounding 0.976 at the end of March 2015. This was the second highest reading in its history, only to be exceeded by an episode in July 1956 with a 0.977 reading.
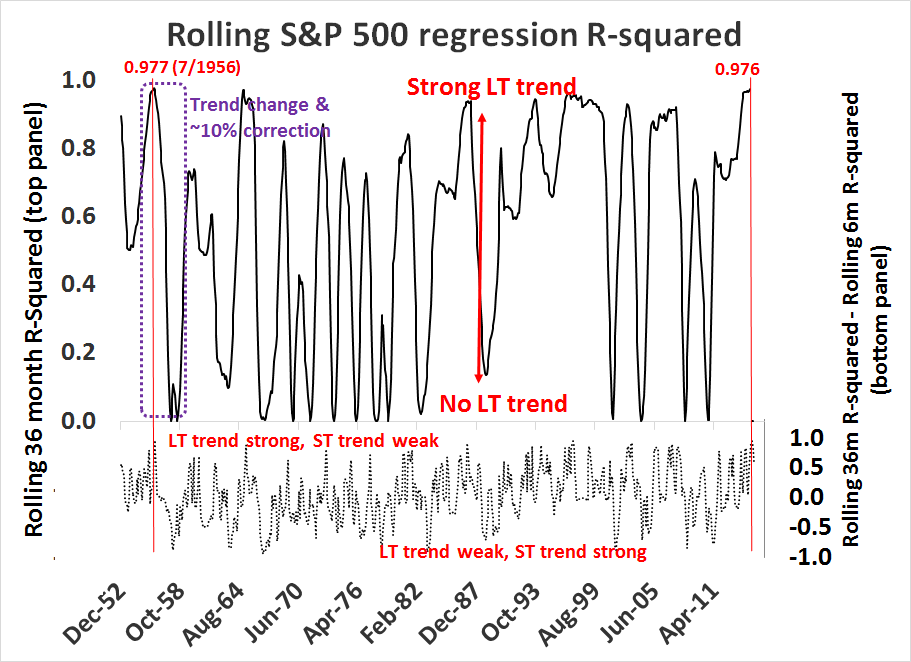
The bottom panel of the chart shows the difference between the rolling 36-month R-Squared and the rolling 6-month R-squared. When the readings are high, it indicates that the long-term trend is much stronger than the short-term trend and when the reading is low, the short-term trend is much stronger than the long-term trend. We have an instance where the long-term trend is strong, but the short-term trend is weak, which can be seen by the choppy up-and-down markets this year.
I have marked with vertical red lines to show how circumstances today are very similar to the instance in July 1956, when the market was trending strongly long-term but choppy short-term. Then, stock prices soon turned down, but the correction was relatively mild as the decline was only about 10%.
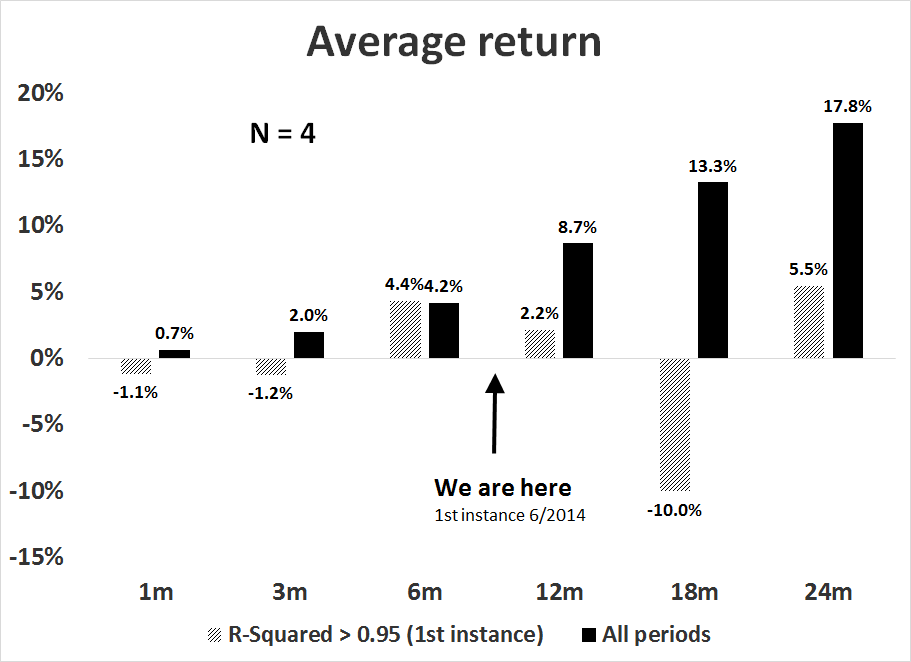
Current conditions are setting up the same way. I took a look at what happens to stock prices when the 36-month R-Squared first exceed 0.95, which occurred last year in June 2014. While the sample size is small, it does give us a rough roadmap as to what happens next. Stock prices continued to rise initially because of the powerful momentum underlying the long-term trend. They then peak out at between 6-12 months, and the decline bottoms out around 18 months afterwards. We are now 9 months into this period.
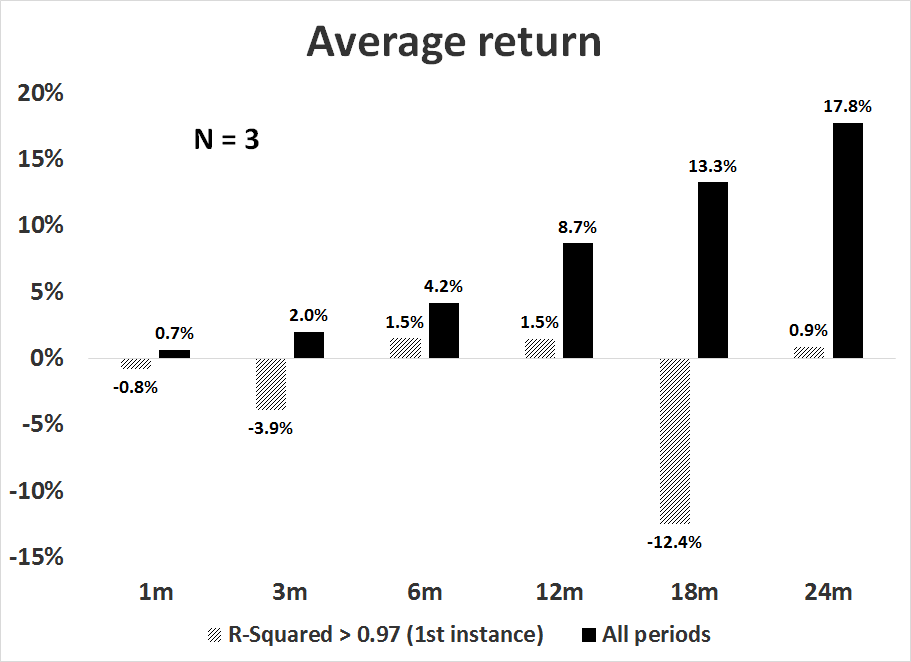
While the number of data points in this study is very small and therefore confidence is low, let me try to torture the data a little further so that it talks. As the 36-month R-squared is 0.976, or the second highest level in its history, I looked at what happened when R-squared was above 0.97. The data points only fell by one (N=3) and the results are instructive. The market decline started almost right away, followed by a rally and a fall into the ultimate low in 18 months.
Watch your time horizon
There are a couple of important caveats to this analysis. I would urge investors not to panic, as this approach seems to be good at forecasting direction, but not necessarily the magnitude of the market move. As there is no fundamental trigger for an all-out bear market in the form of a recession on the horizon, my base case scenario calls for a correction, much like the episode seen in 1956.
As well, traders need to keep in mind that the time horizon for this analysis is in months, while the time horizon for many traders is in days or even minutes. While stock prices are likely on the verge of an intermediate term top, that doesn't necessarily mean that the market goes down right away. Bret Steenbarger wrote a series of excellent posts where he observed the conditions of strong long-term trend, but weak short-term momentum. Here is one example:
The recent rise in realized volatility and vol of vol helps to explain why short-term traders have had difficulty trading U.S. stocks: We've had movement, but not trend. It's been a choppy, volatile range trade. Buying strength or selling weakness--trading with a fear of missing out--has been a consistent way to lose money. Viewed on a longer time scale, however, this market appears to be one of narrowing breadth--even among those smaller cap sectors that have been strongest. That keeps me cautious
In subsequent posts, he adopted the trader's perspective to say that current breadth readings does not support an imminent bear attack. One example here:
As a whole, the signals are showing reduced breadth of market strength, but not net weakness--consistent with the waning breadth readings noted in yesterday's post.
And here:
While a market without weakness might appear "overbought", in fact it is healthy in the short run. In order for the broad stock market to roll over, we have to see some leading stocks and sectors display weakness. At the moment, we are indeed "overbought", but not weak.
In other words, be cautious, but don`t get too bearish.
A test this coming week for bulls and bears
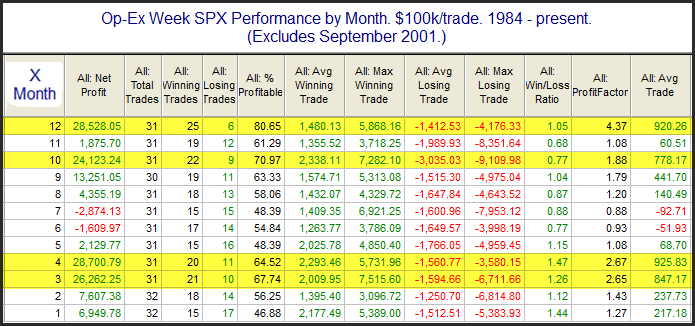
If I am correct in my analysis, we are in for more choppy markets. The week ahead will be a key test for my thesis. On one hand, overseas markets have rallied, which is bullish from an inter-market analysis viewpoint. As well, the upcoming week is option expiry week, which has historically had a bullish bias. This study from Quantifiable Edge shows that April OpEx has been one of the most positive weeks in the year:
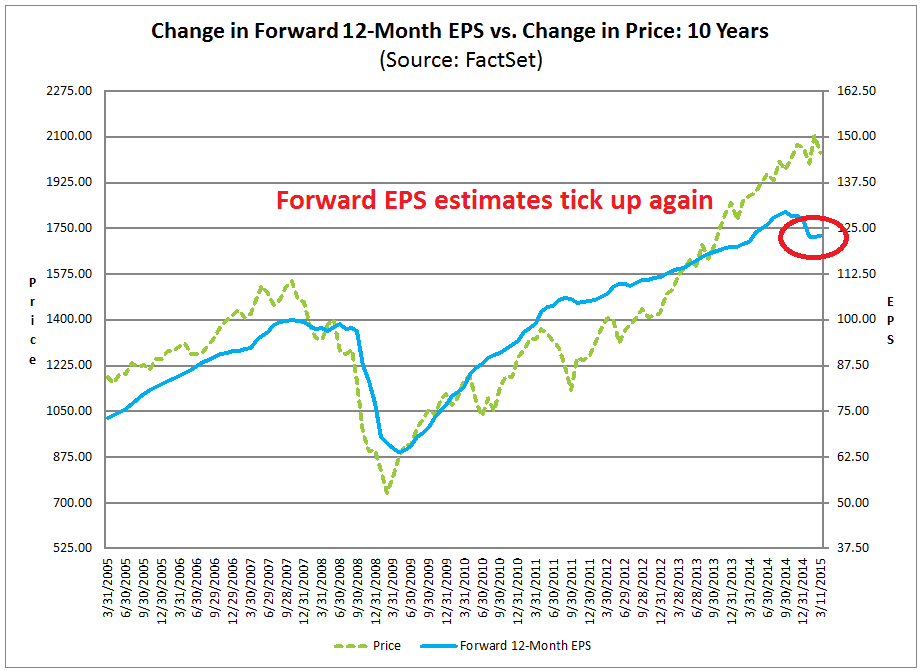
Earnings season starts in earnest this coming week. The latest update from John Butters of Factset shows that Street forward 12 month EPS estimates are edging up again, which is a positive sign for equities:
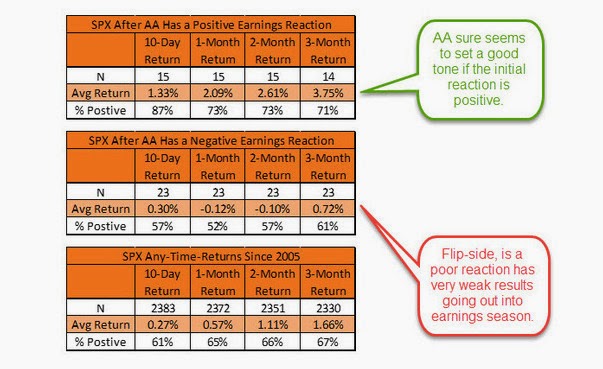
On the other hand, the market is short-term overbought and it has paused at these kinds of levels in 2015. In addition, past analysis from Ryan Detrick showed that the reaction to Alcoa (NYSE:AA) earnings can be an early portent of stock market action. (Recall that Alcoa beat expectations on EPS, but missed on revenue estimates and the stock tanked as a result).
No doubt there will be lots of headline driven volatility in the days ahead. But if stock prices can't manage to stage a meaningful advance this week in light of the bullish tailwinds, it will be a validation of my choppy market and intermediate term top thesis.
My inner investor is cautious, but he is setting his stock-bond mix at policy weights. My inner trader is cautiously short the market with tight stops in order to to scalp a possible move to the bottom of the recent trading band.
Disclosure: Long SPXU, SQQQ
Cam Hui is a portfolio manager at Qwest Investment Fund Management Ltd. ("Qwest"). This article is prepared by Mr. Hui as an outside business activity. As such, Qwest does not review or approve materials presented herein. The opinions and any recommendations expressed in this blog are those of the author and do not reflect the opinions or recommendations of Qwest.
None of the information or opinions expressed in this blog constitutes a solicitation for the purchase or sale of any security or other instrument. Nothing in this article constitutes investment advice and any recommendations that may be contained herein have not been based upon a consideration of the investment objectives, financial situation or particular needs of any specific recipient. Any purchase or sale activity in any securities or other instrument should be based upon your own analysis and conclusions. Past performance is not indicative of future results. Either Qwest or Mr. Hui may hold or control long or short positions in the securities or instruments mentioned.
