Tuesday's sell-off did much to rattle the confidence of bulls; Thursday's attempt to bid markets back to Tuesday's highs lacked confidence as demonstrated by the relative gain and the lighter volume. Friday is an opportunity to give markets a little boost heading into the Easter weekend. Futures suggest a positive open so it will be a question as to whether markets can build on it.
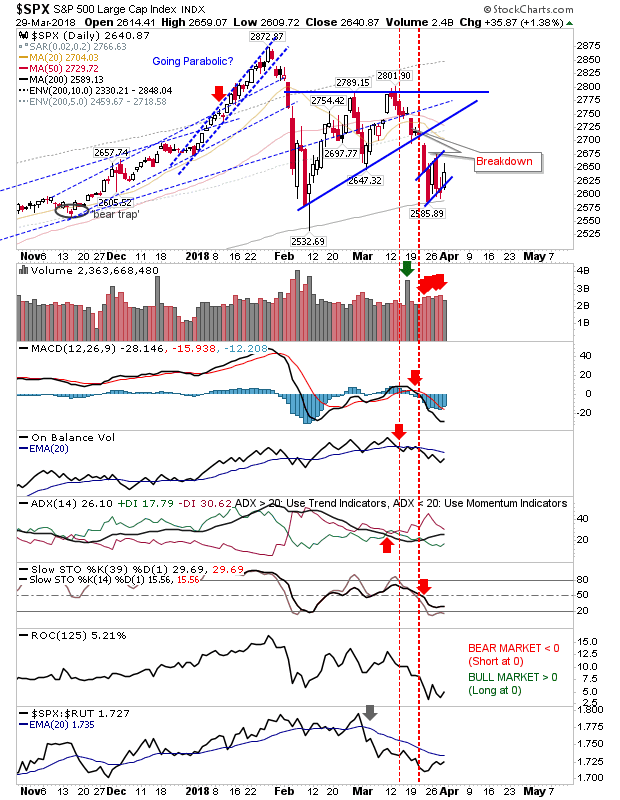
The S&P is still shaping a 'bear flag' on the bounce off the 200-day MA. While technicals are net bearish they are not oversold.
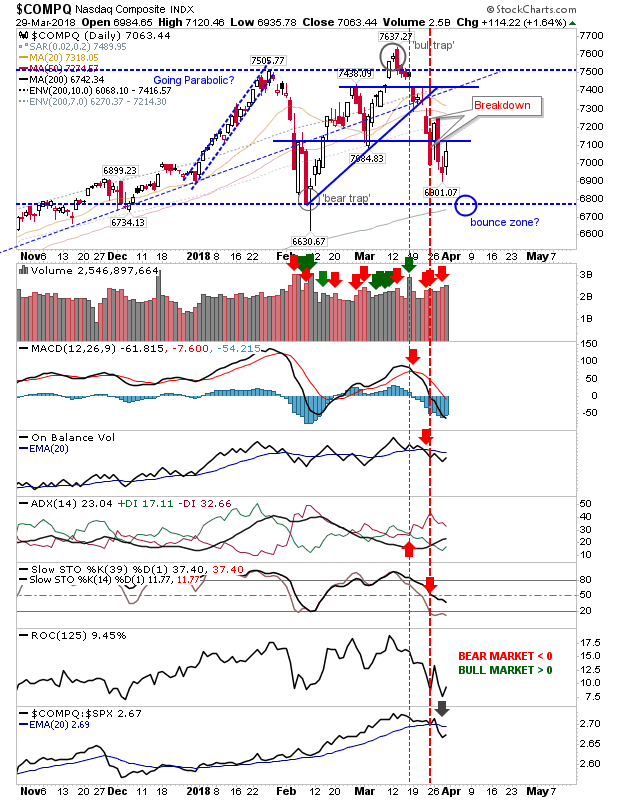
The NASDAQ is attempting to mount its recovery from a point well above the 200-day MA. As the index has just dropped below the stochastic mid-line it has entered the early phase of a bearish environment. The index is someway from oversold conditions sufficient to suggest a decent bounce could emerge but if it can recover 7,125 it might not need the oversold status. A good place to look for an oversold bounce is the 200-day MA.
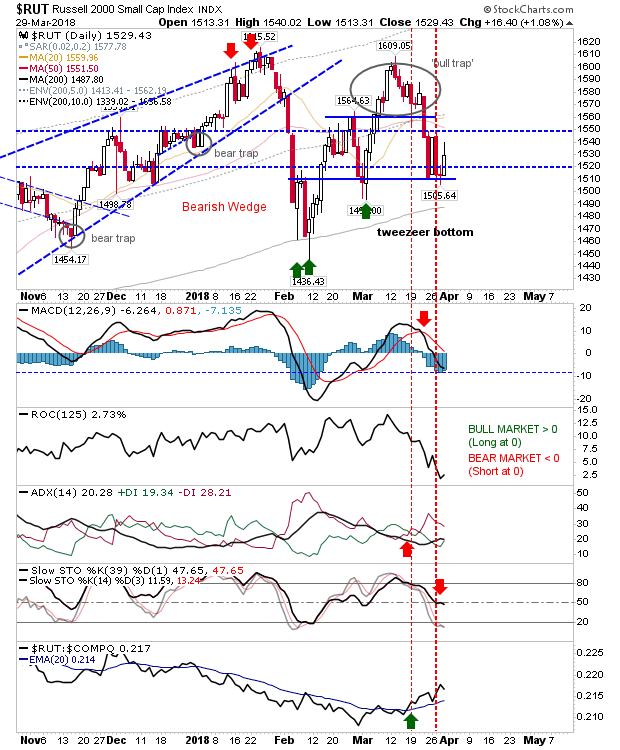
The one market which is providing a platform for a bounce is the Russell 2000. It's down at the level which sparked the rally off the 'Tweezer Bottom' and the highs from the original bounce off the 200-day MA. Technically, stochastics are right on the mid-point where bounces in bullish markets occur. The Russell 2000 is also the index enjoying the relative advantage after months of underperformance. If it can't hold 1,500 support I would have big concerns but it's perhaps the best play for bulls at the moment.
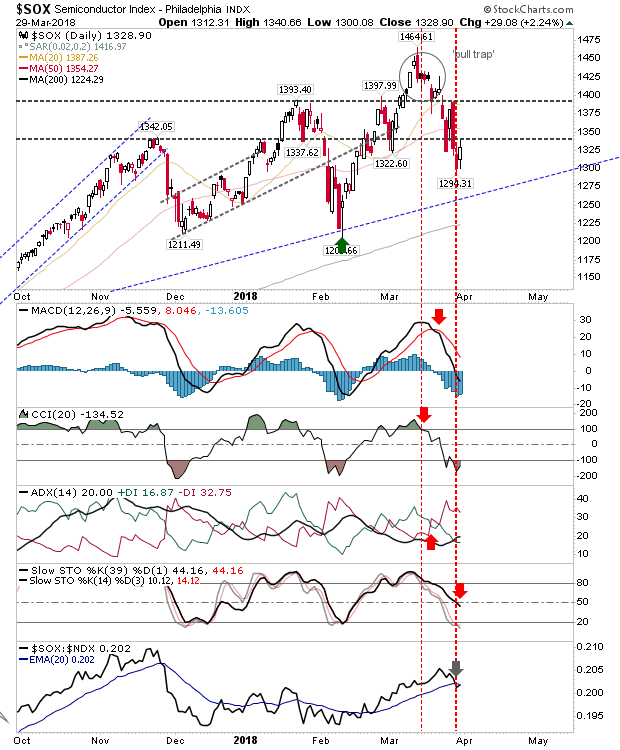
The other index I'm watching the Semiconductor Index. The push to new multi-year highs in March had looked like it was going to bring the Nasdaq indices with it but with the first leg of the 'bull trap' in effect the next step is typically a test of the prior low which is down around 1,200.
The preferred bearish play is perhaps the Dow Jones Industrial Average. It too is shaping a 'bear flag' off the 200-day MA like the S&P but the latter 'bear flag' is shaping up right from the spike low at 23,400. There is very little room for maneuver for bulls and I wouldn't be surprised to see this flag break in a 2-3% one-day loss. It has to break though...
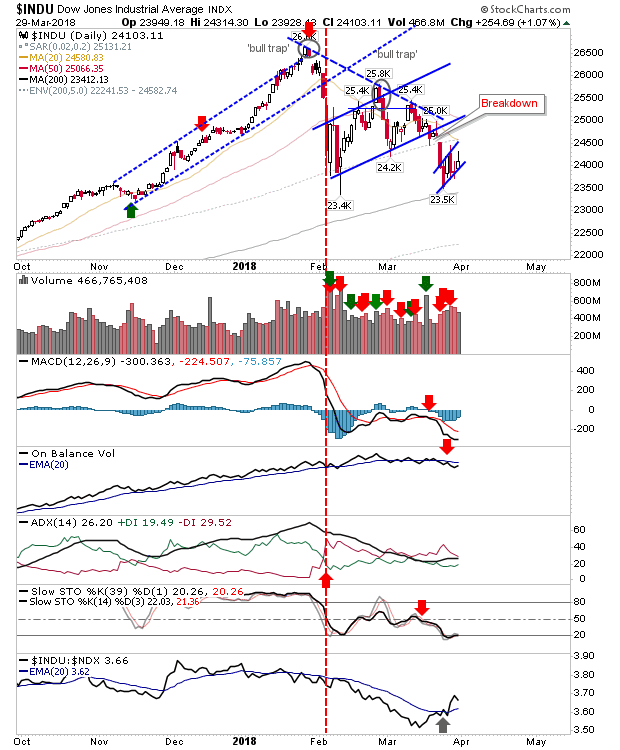
So for today, bull traders keep an eye on the Russell 2000, bears on the Dow Jones Industrial Average.
