RUSSELL 2000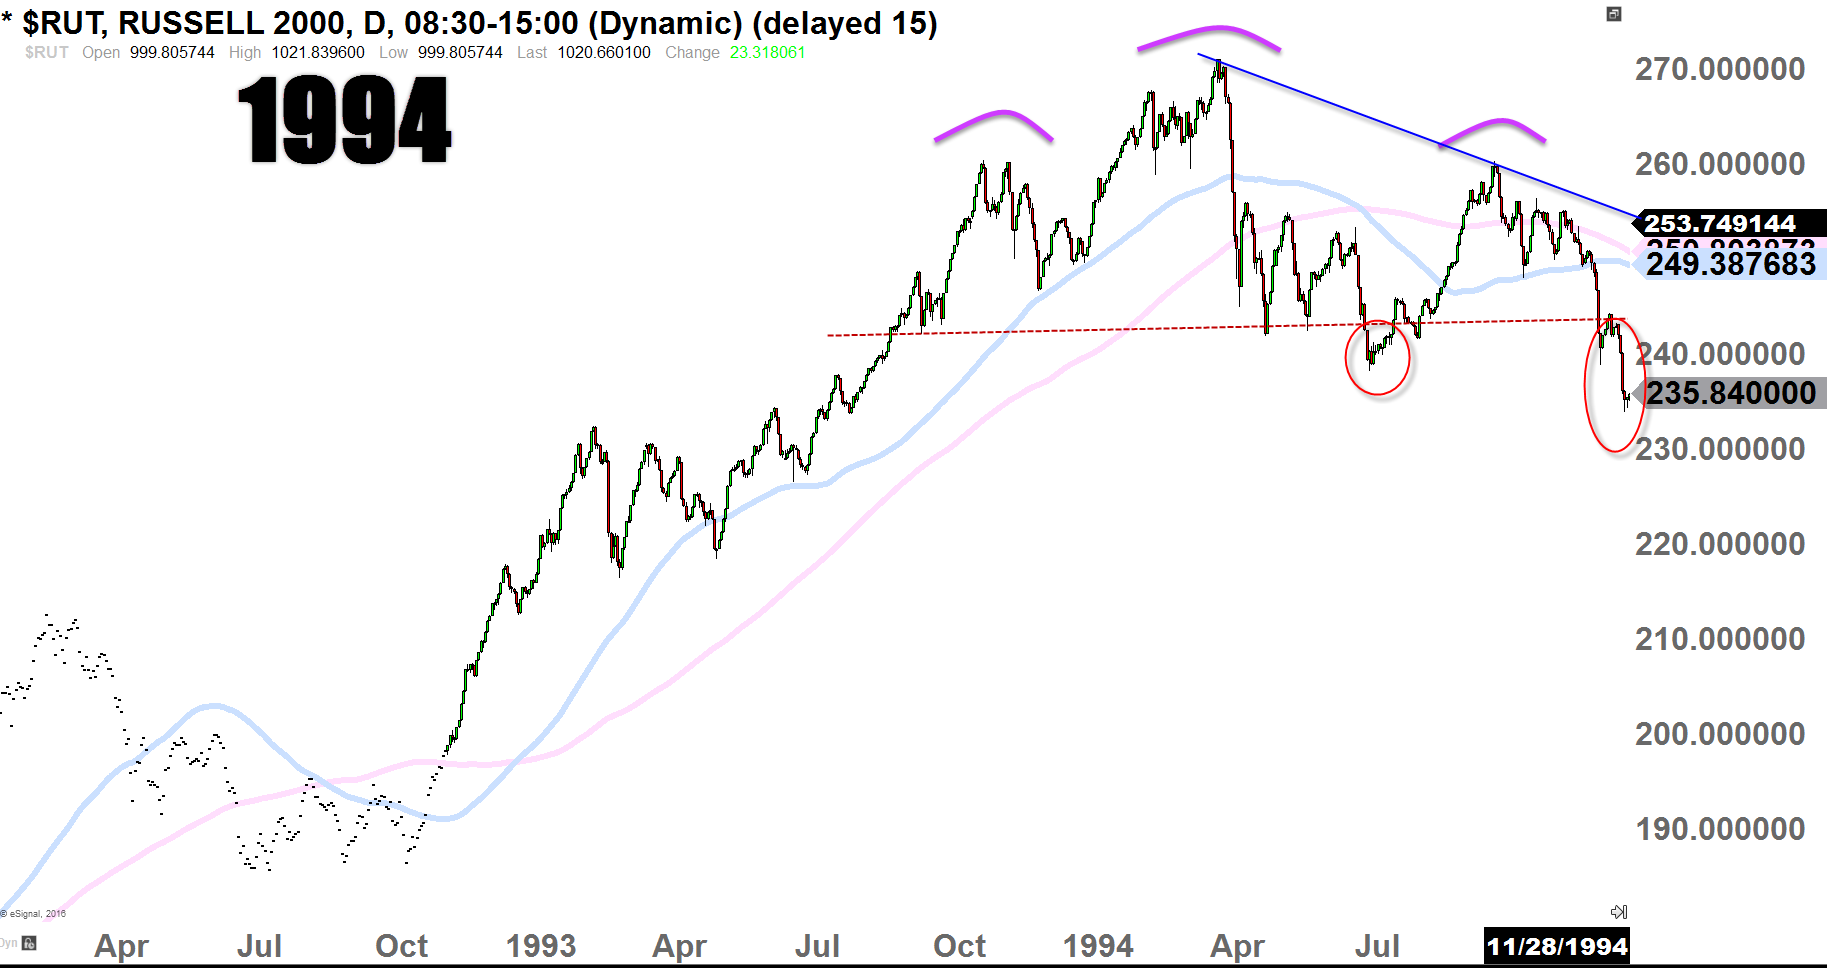
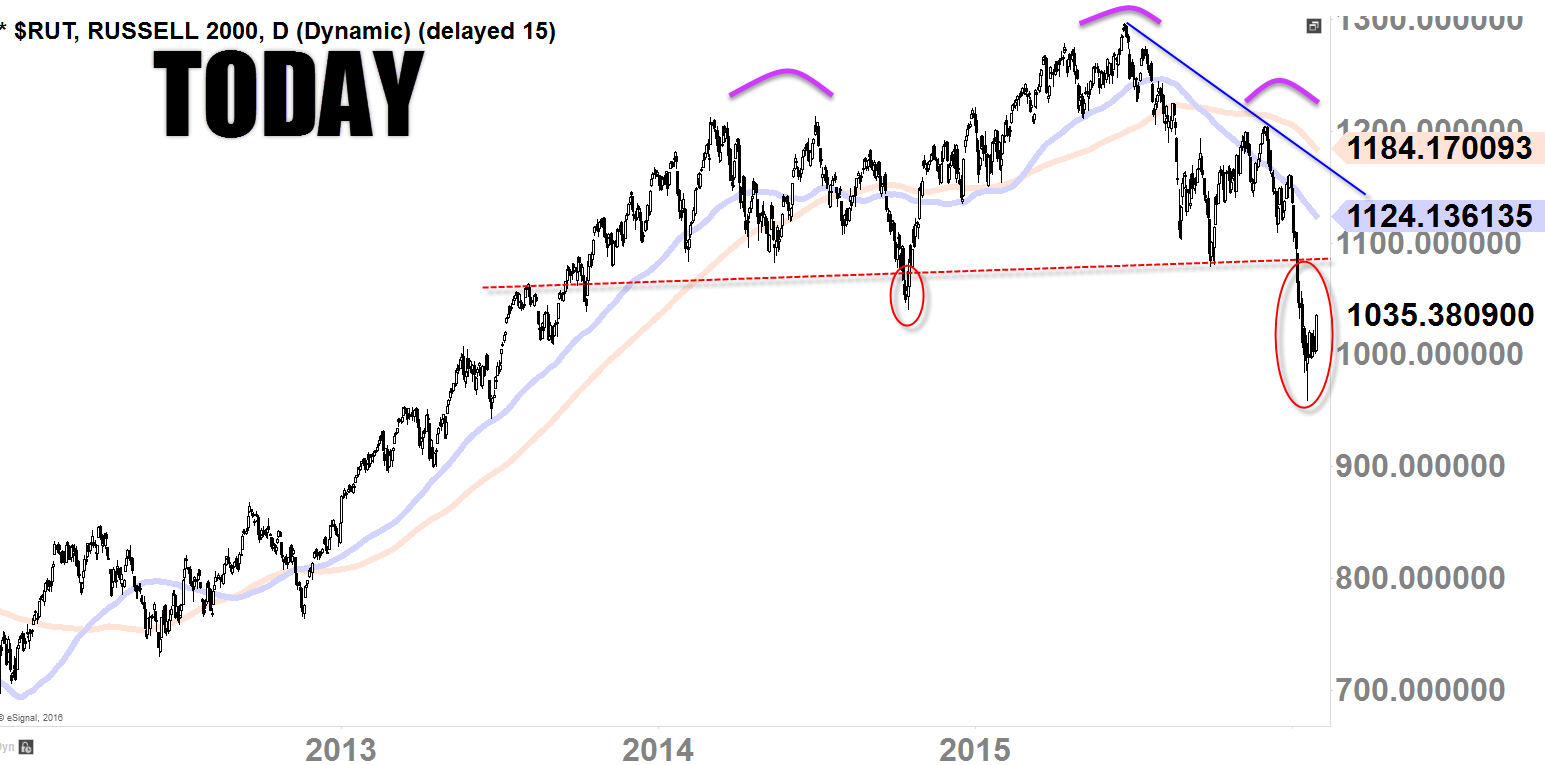


Biggest concern in the market today is the fact that the small-caps are rolling over; we also have massive H&S reversal formation with an "initial" confirmations (the price-line has broken below the neckline); not to mention, the cultivation of a lower high.
This is a huge warning signal in the market today, which could potentially lead this market to a much more violent selling.
So the question is, will it play out? Will we see another market crash like we've seen in 2000 and 2007?
Current topping pattern (H&S reversal)'s scale is the size that could potentially bring the whole market down; it's a monster for sure.
Historically speaking though, we've had similar activities back in 1994 on the Russell as you can see in the chart below.
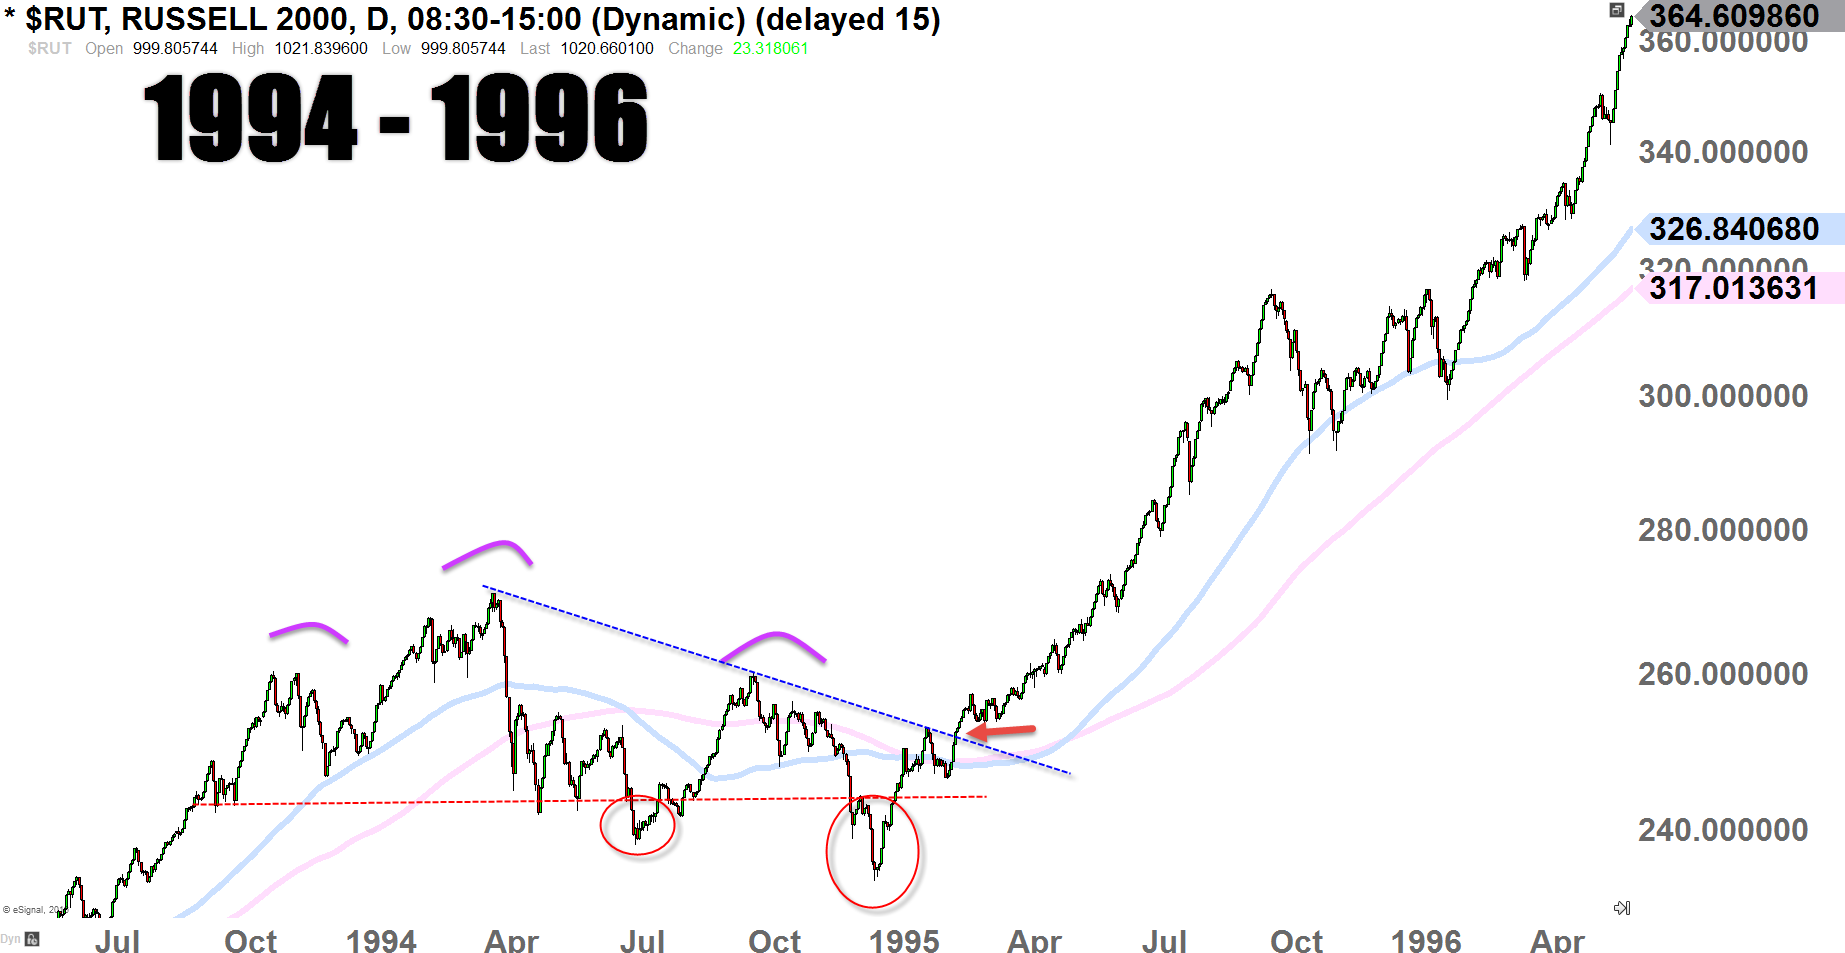
At that time, too, looked as though whole market was about to completely collapse, but it was amazing what happened next as it became a historical proportion of a "bear trap" (see third chart), and bull market continued on for another 5 years (until the crash of 2000).
But observe how fast it turned things around back in 1994. We've had almost year and half cultivation of H&S reversal formation (scale that could crash the market), and then, just in short few months, market "V" shaped higher and never looked back! That's crazy how fast the sentiment changed from the "extreme fear" level to a "buy frenzy." But then again, this market is known for this kind of shenanigan, it feeds upon the fear to thrive itself.
DOW JONES INDUSTRIAL AVERAGE
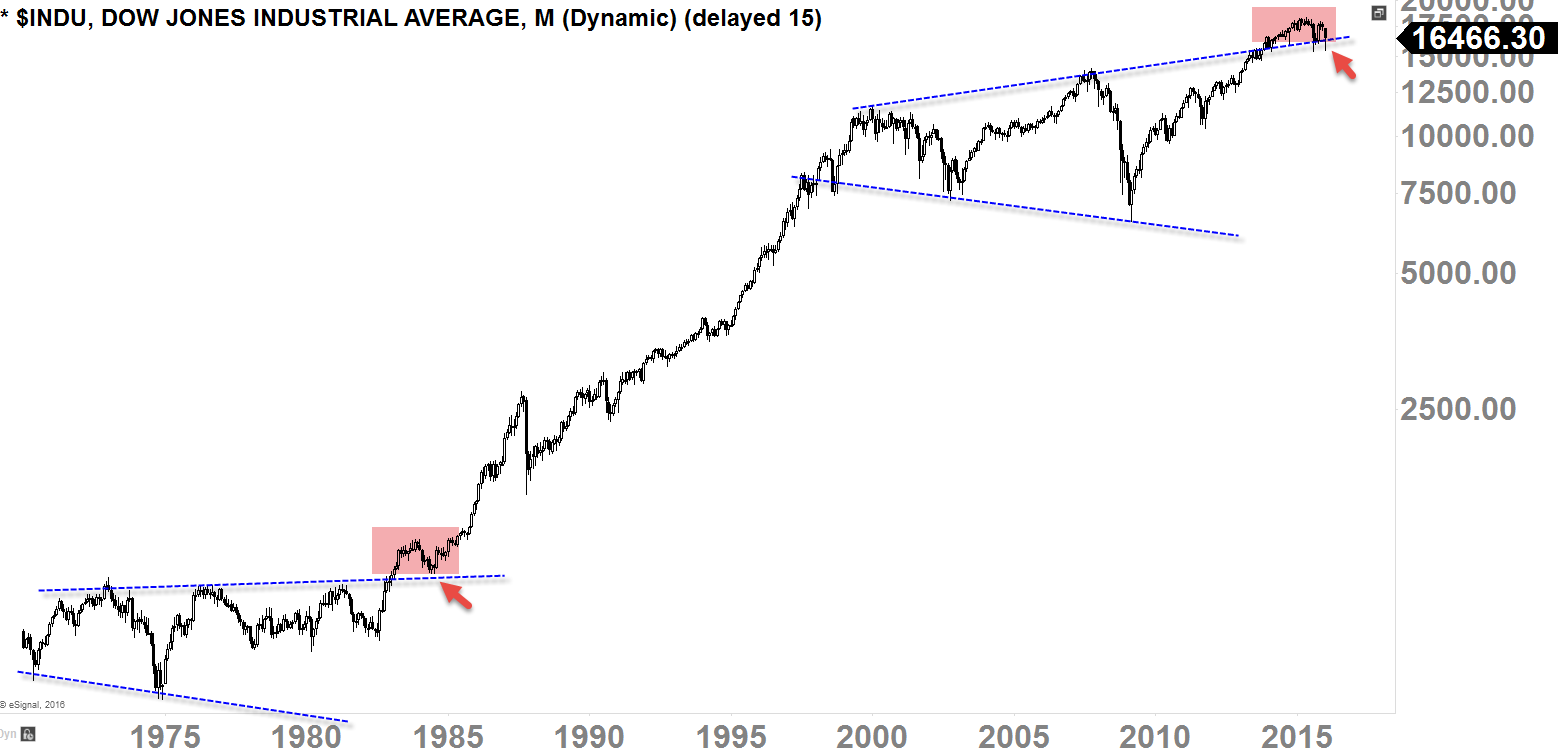
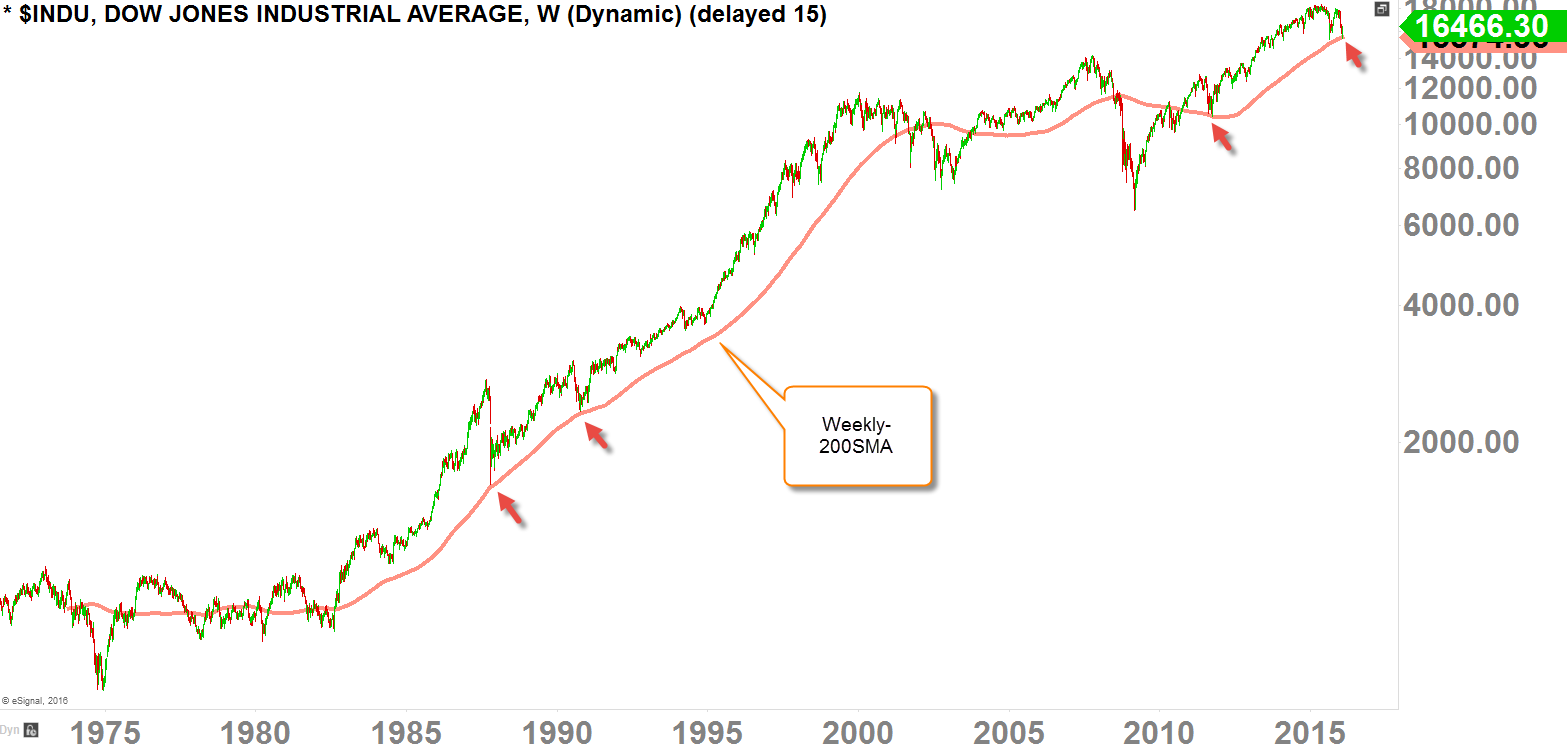
You are looking at Monthly and the Weekly-chart of the Dow.
Monthly-chart (first chart) is actually very significant as far as the Technicals are concerned. If we lose this level (red box) on this monthly-chart, it will be considered as the massive "bull trap"; and if that's true, the Dow could potentially fall all the way back down to the 'mega phone' pattern support at 6000-level.
But like 1985, if we bounce at this level, we could see another burst of secular bull market for many years; so this is an absolutely a pivotal level for the future of the Dow.
Looking at the weekly-chart (second chart), we can see that the weekly-200SMA (moving average) currently acting as support, though we haven't completely bounced yet (selling is slowing down here with short-term buying acitivity).
I would also stress this level (weekly-200SMA) as the "last level" for this market to survive. If we lose this level to the downside, that might be it; we may not see bulls roaring for a long time. However, if we find strong support at this level another secular bull market inauguration might be in stored.
DOW JONES TRANSPORTATION AVERAGE
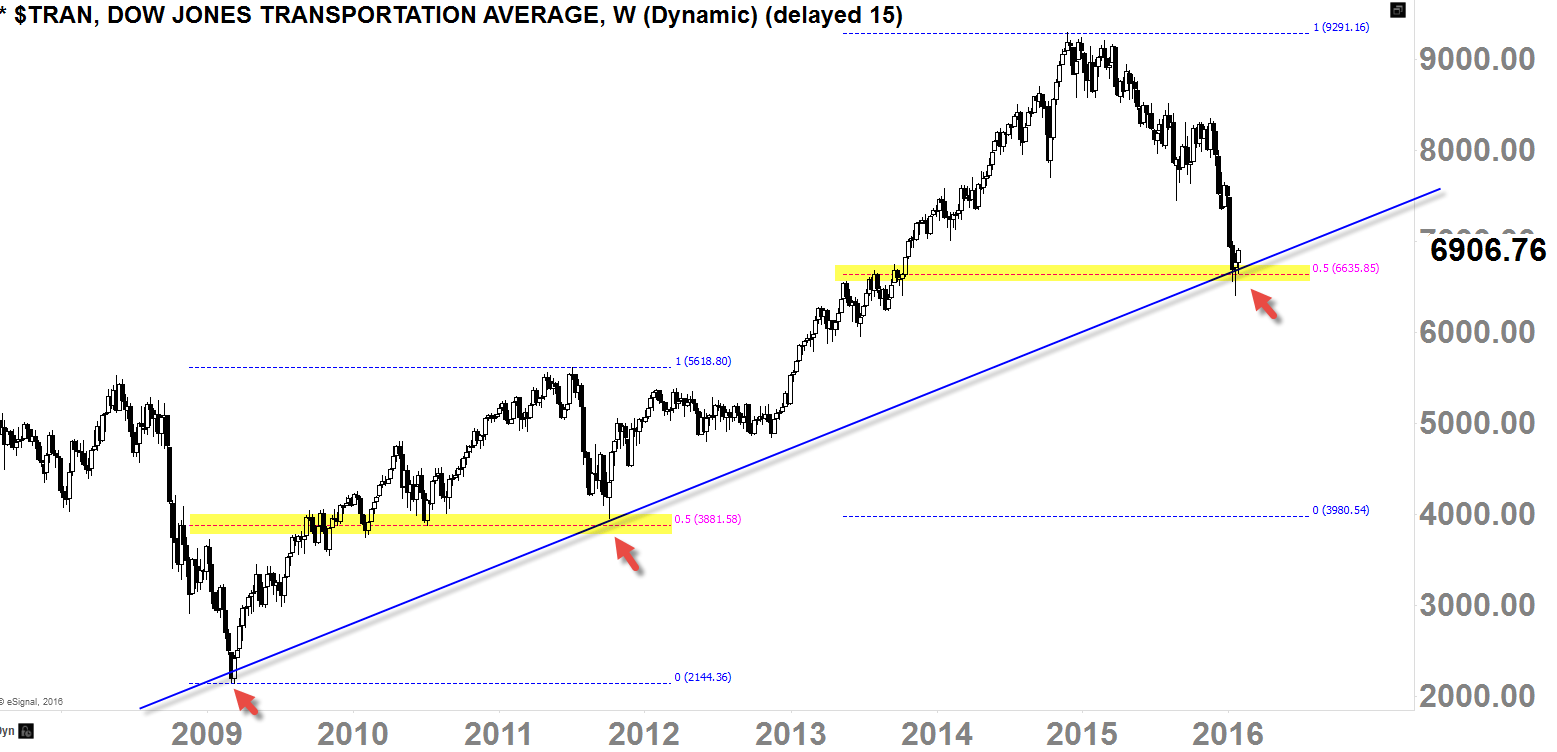
Much of the talk now days along with the small-caps (Russell 2000) is, how the Transportation has completely rolled over and it is giving us a massive warning signal in the overall market; and rightly so.
Transports has lost so much its ground, chart is completely broken, and we might even continue lower. But I've found interesting level of support as I was doing my Fibonacci study on this weekly-chart.
It looks like as though, buyers are just barely grasping for air as we are dangling around right on that Fib. 50% level and the rising uptrend support.
I would have to say, that this is probably going to be THE last level if the buyers do not want to see major crash in the Transport. With the rising support coinciding with the 50% Fib. retracement level, this might be the last savior if the bulls want to make something happen.
NYSE COMPOSITE INDEX
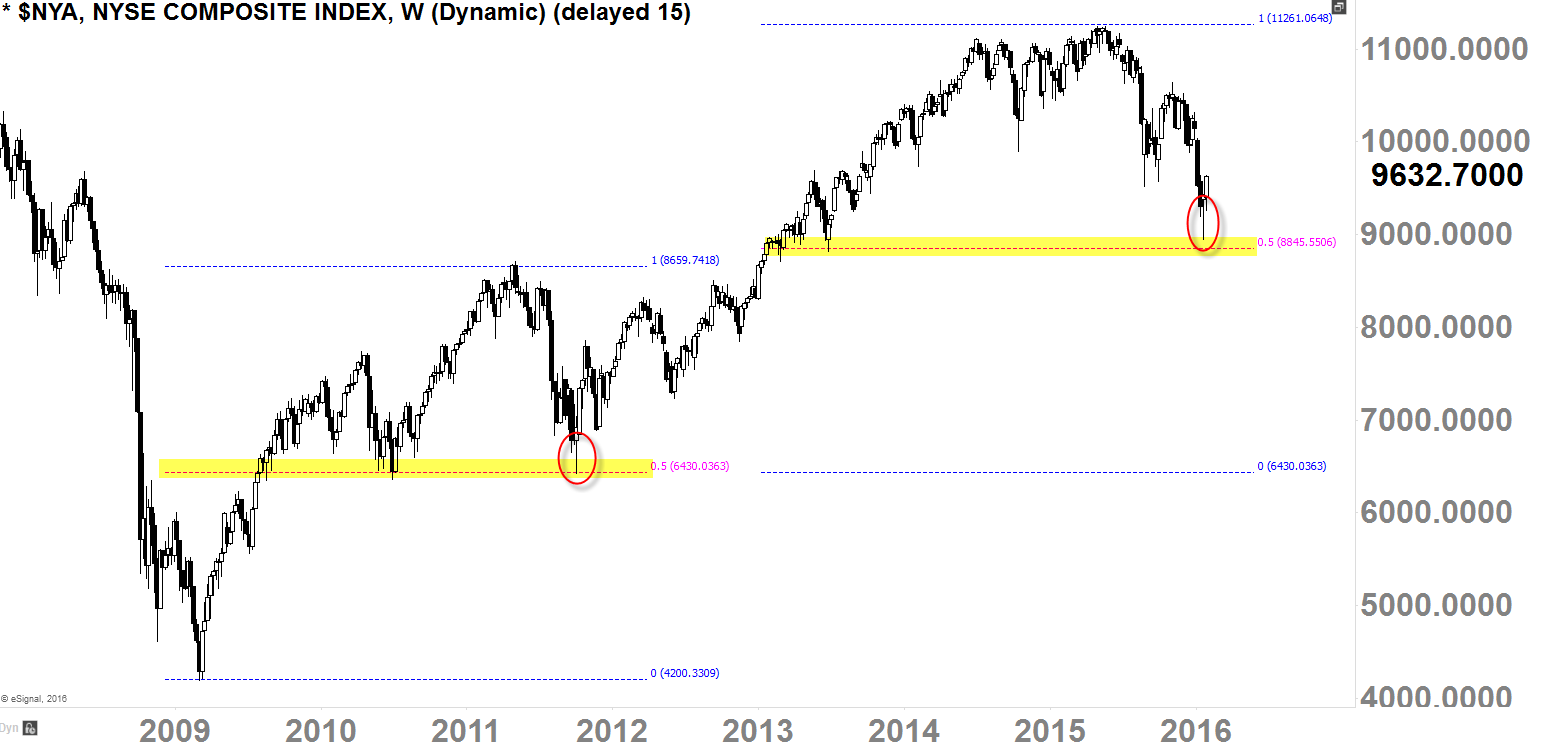
Along with the Russell 2000 and the Transportation Average, it's the NYSE that also has a huge warning signal in this market as it has already cultivated lower-low and lower-high. Which means primary-term downtrend might have already commenced here. But similar to Transportation Average, 50% retracement was the "magic" number back in 2011 corrections, and we are currently slowing down right on the 50% retracement level. There is a one way where buyers could totally turn this thing around to the upside, and here is how.
- Bring up the price back up to the 10,500-level
- Pull back down to the 9700-level
- Break above 10,500-level
- That would be an Inverted H&S Reversal
If we can see that, this market could see another 2-3 years bull run; but if we lose this 9000-level, things could get much worse.
PHLX SEMICONDUCTOR
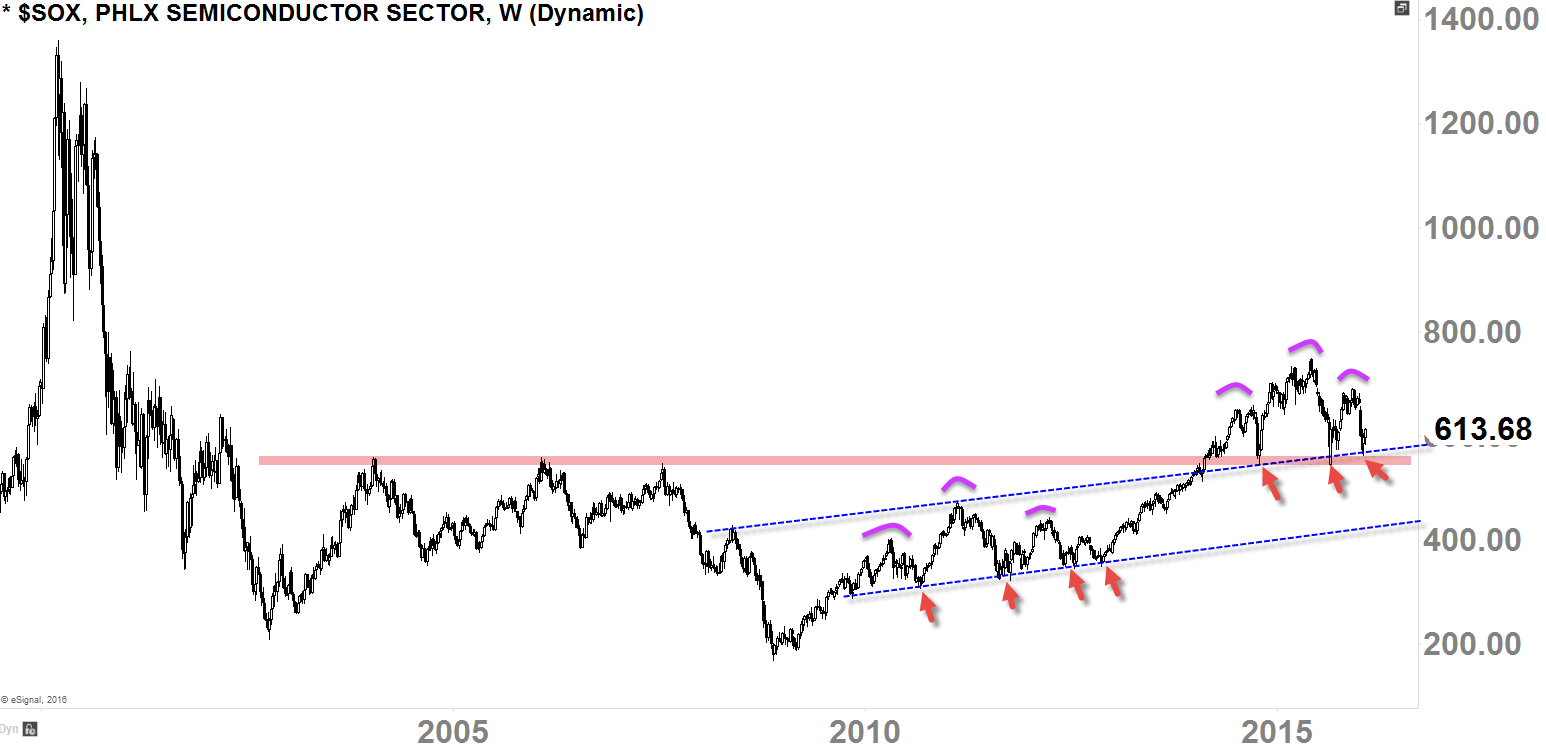
H&S reversal formation is always concerning as it heaps upon condemnation, but as always, "confirmation" is the key, without it, it might just be a scare-tactic.
2011, this index also suffered with that H&S formation, but as you can see, it never played out; in fact, it was the after that fear (around late 2013), this index flourished for few years straight (I mean you have like 2 years of massive H&S formation cultivation from the bears, and then it just "v" shape higher (2013-2015) like it never happened!).
That's how this market thrives. It thrives upon fear, and it suffers upon optimism.
Today, we currently do have H&S formation without confirmation above the major pivot-level. Like it did back in 2013, if the buyers can smell the opportunity through this fear, I think we could have another run for few years.
But if we lose this major pivot level and confirms the H&S pattern, it could be the demise of this index. Again, "confirmation" is the key as the market thrives upon fear.
NASDAQ COMPOSITE INDEX
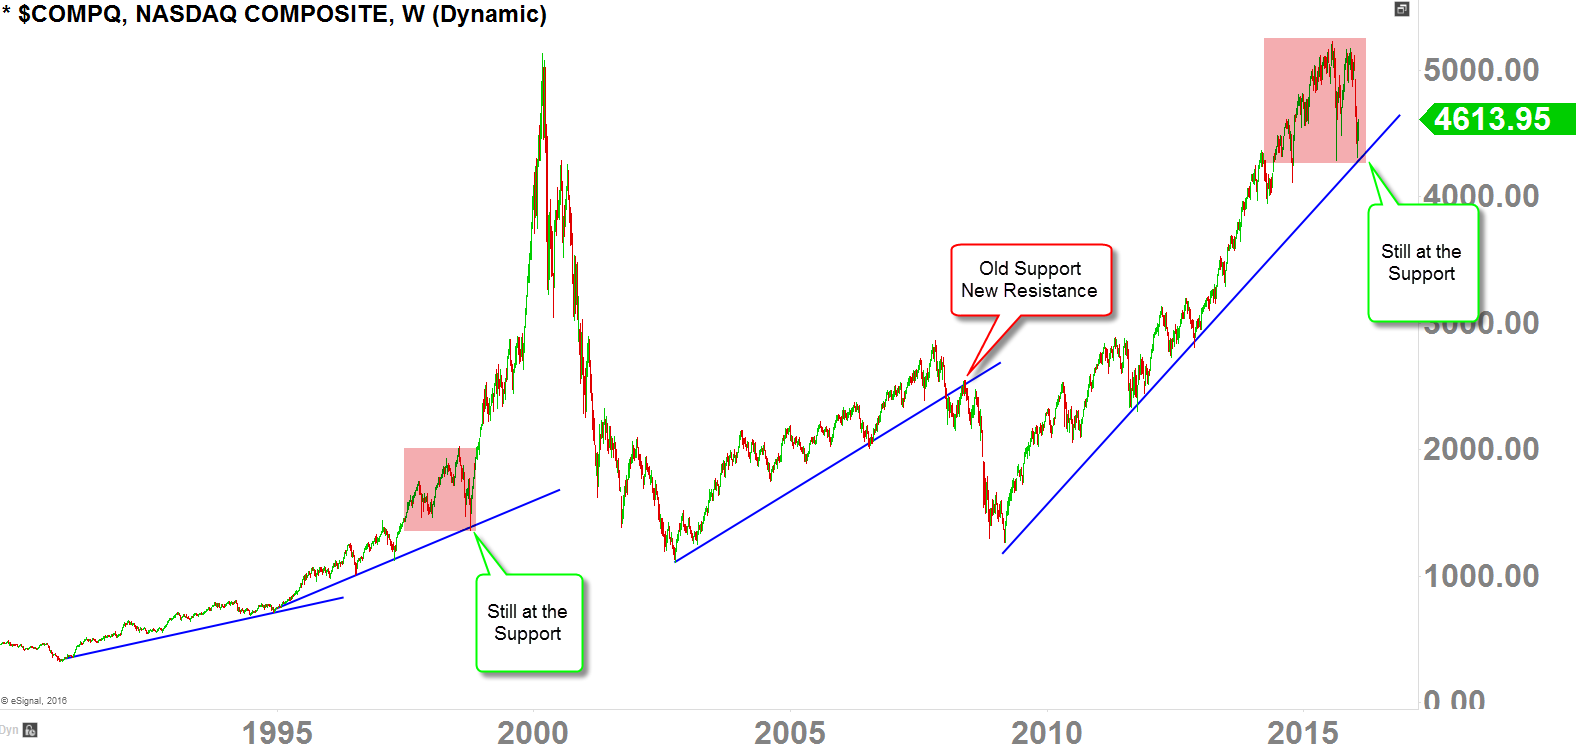
Technically speaking and looking at things in a long-term perspective, we are still in a primary-term uptrend on the NASDAQ as of today.
But we do have potentially, deadly, major topping-pattern at hand like all other indices; if this thing confirms, could be deadly over the whole market. But remember what we've been talking about on this article:
- Confirmation is they key
- Market thrive upon fear
I am not saying, if we bounce from here, we are going to see a major bubble move like we've seen in 1999-2000. What I am saying is this; 'benefit of the doubt' actually still goes to the buyers in the long-term perspective given the fact that we are "still at the support."
NASDAQ is actually the strongest index as of today.
S&P 500 INDEX
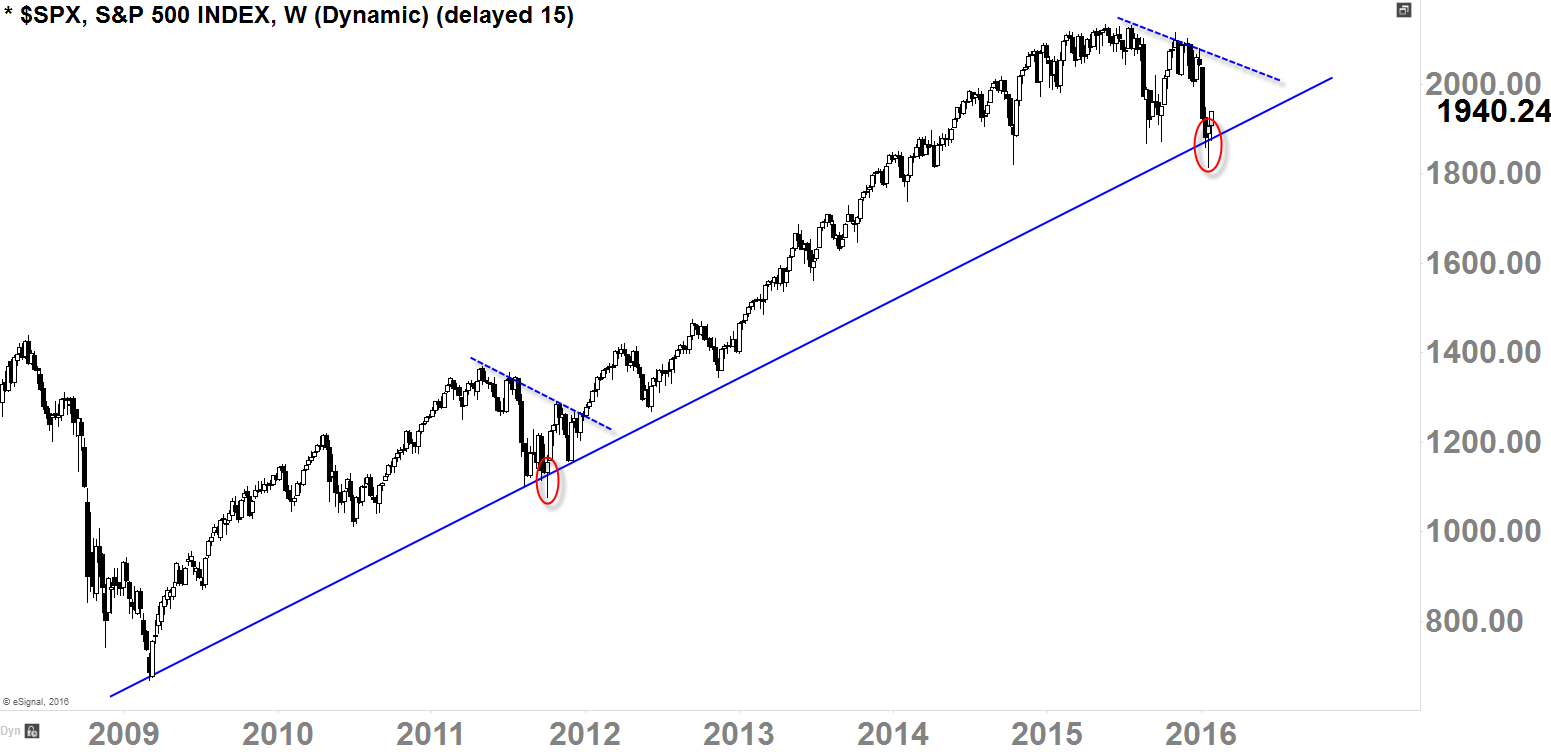
Chart 1 (weekly-chart):
- Currently sitting on rising-uptrend support
- Threw a Hammer reversal-candle last week, and follow through this week
- This is the last level of major support
- This support is also the "neckline" of that massive H&S reversal pattern (not "confirmed" yet)
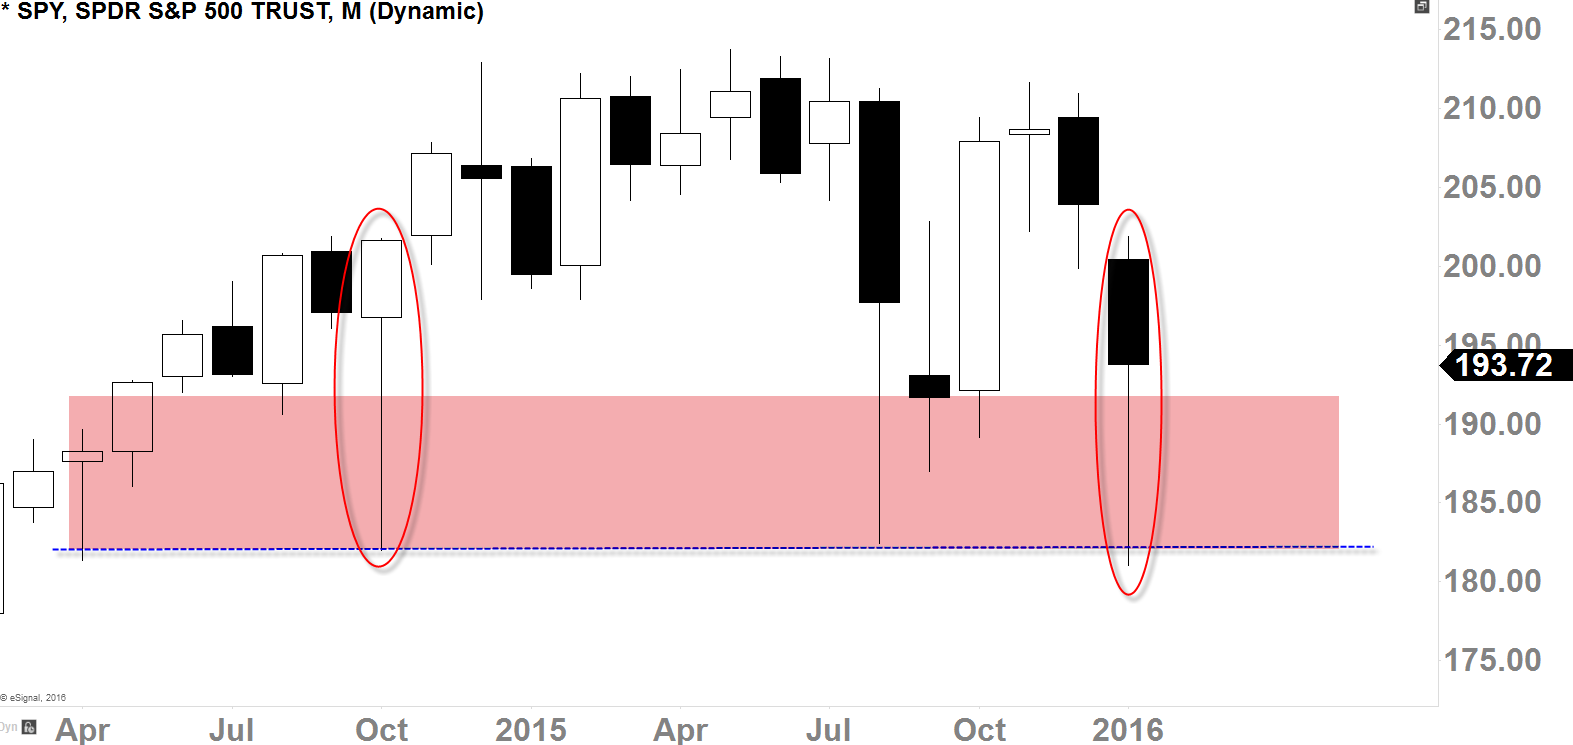
Chart 2 (monthly-chart):
- N:SPY 180-190 level continues to be protected by the buyers
- Monthly-Hammer candle printed only because of one-day's rally on Friday (1/29)
- Above 200-205 for continuation
- Still choppy sentiment
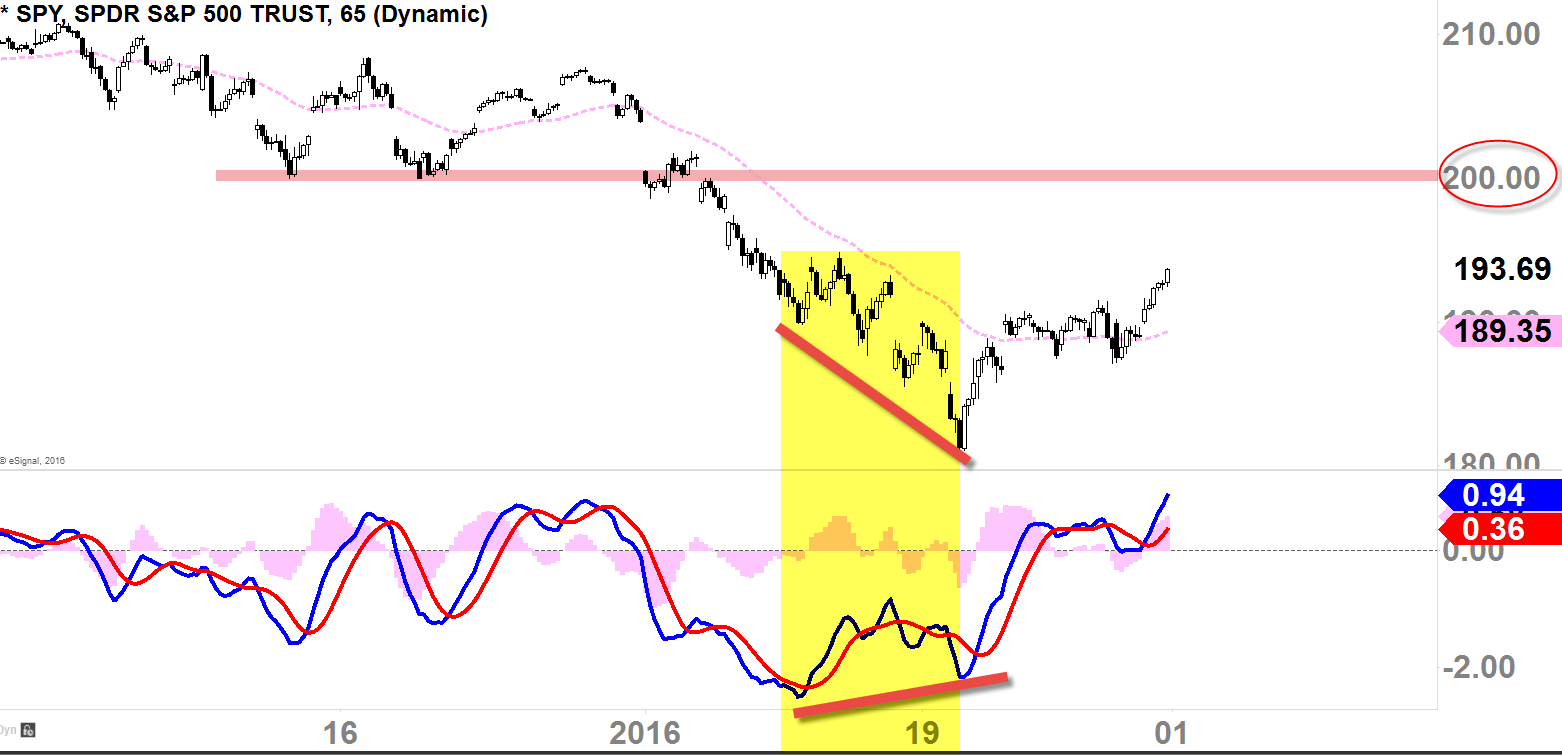
Chart 3 (65mins-Chart | minor-term perspective):
- Bullish divergence formed about a week ago, and currently playing out
- Staying above 50EMA (pinked dotted) so far
- 200 is the next major resistance
Final Thoughts
As I have demonstrated in detail, that major indices are now at the LAST LEVEL of support.
This is where things could get very psychological (back to back traps, shenanigans, head-fakes and etc.) as the market decides it's primary-term direction.
I do not want to discount the fact that we are in a dire situation in the market; and we have potentially deadly warning signal. Some of these H&S formation pattern has been formed with 2-years of cultivation from the bears; it's the size that could sink this Titanic.
But, before I dive into the idea that we are going to get into a steep correctional move (bear market), I wanted to make sure that I am looking at every angle before I come to a conclusion. That's the luxury we have in Technical Analysis.
We've seen in 1994, where the market was ready to nose-dive, but it shot right back up. We've seen in 1998 (NASDAQ), where the market was ready to nose-dive, but the last level of support gave it another shot for few years of bullish run.

