by Pinchas Cohen
The Big News
- S&P 500 and South Korean KOSPI achieve record high
- VIX returning to historic lows
- After credit cut, Chinese financial shares lead Asian rally, but on suspiciously low volume
- Dovish ECB staying course, euro rises
- Oil continues rally on option to further cuts extension
World Events
The Fed minutes released yesterday, gave equity traders the confidence that led the S&P 500 to close at a record high. Asian stocks continue to rally, along with oil, ahead of OPEC's expected announcement on an extension limiting barrels per day production, creating a repeat of trader sentiment similar to what occurred around last November’s surprise deal.
While stocks received a boost by the release of the Fed minutes, the dollar took a hit, as prospects of rate increases beyond June become murky. Most Federal Reserve officials judged “it would soon be appropriate” to tighten monetary policy again, and backed a plan that would gradually shrink their $4.5 trillion balance sheet. In April, Fed officials noted equity market valuations which had risen above historical norms, while the current language was a bit softer, instead citing expectations for “robust” earnings growth in 2017.
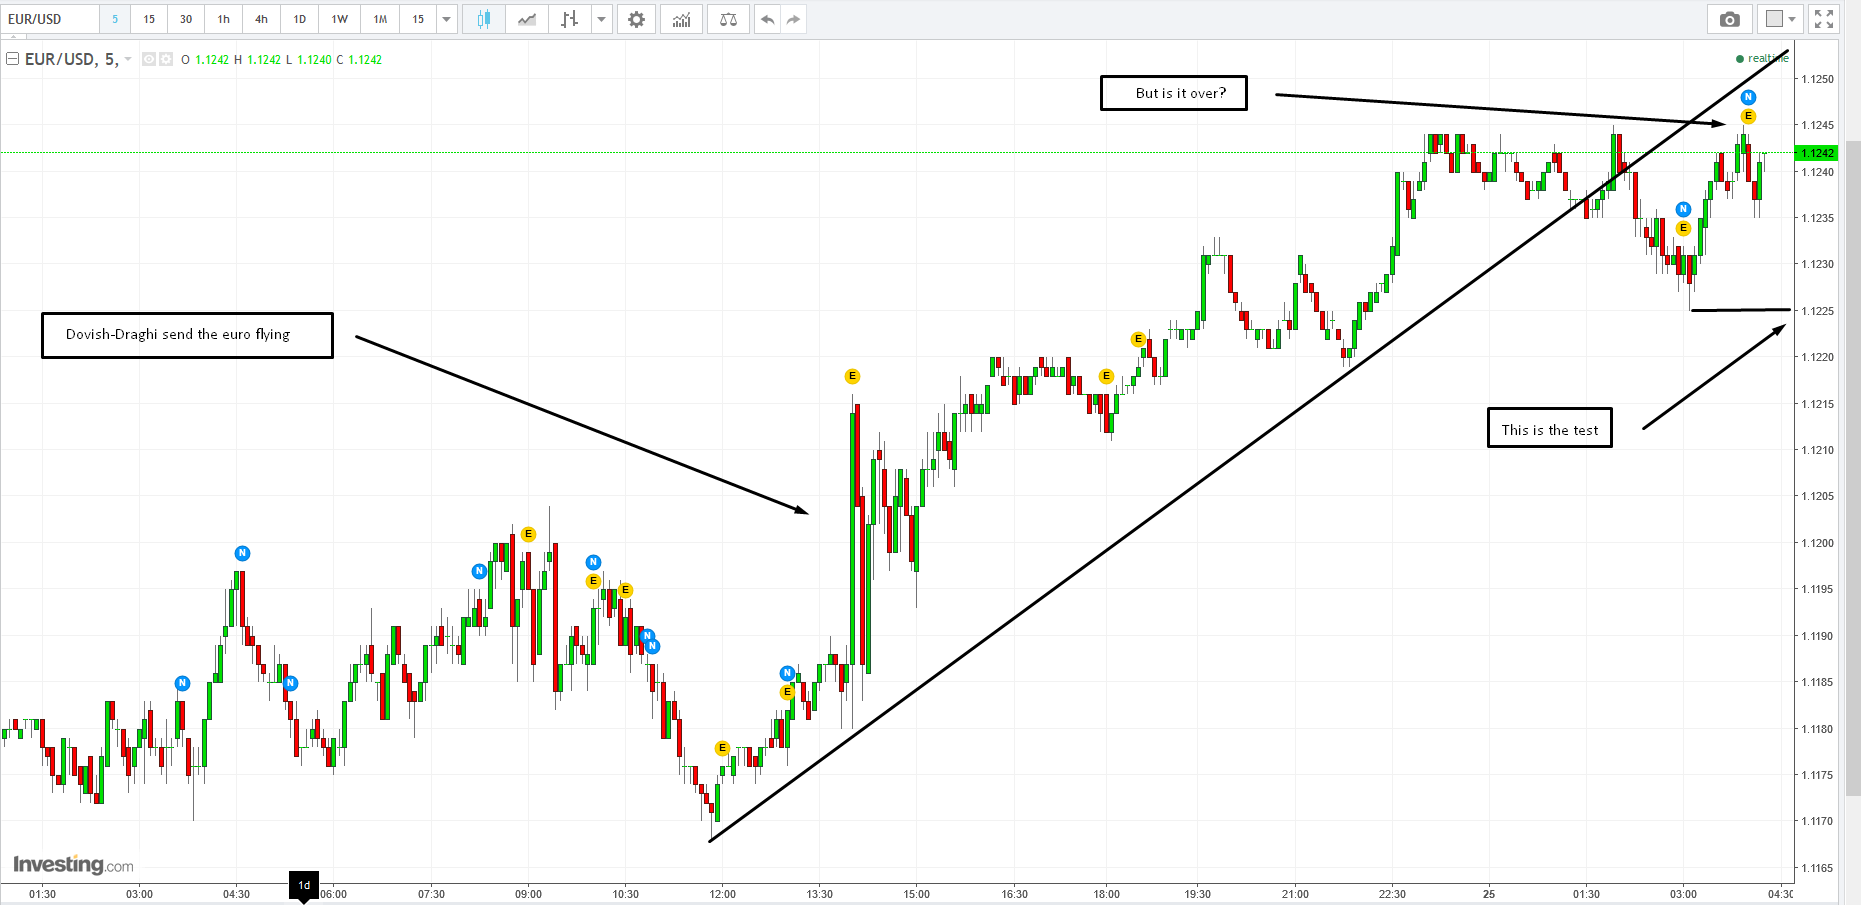
Meanwhile, ECB President Mario Draghi delivered a dovish message as he sided with Peter Praet, in advocating caution. He expects rates to stay at current or lower levels, until well after the end of quantitative easing. Bond purchases are scheduled to continue until at least the end of this year, and investors and economists are looking for hints that the program will be tapered in 2018.
Draghi balanced his caution with optimism, reiterating that the euro-area recovery is proving resilient and has become “increasingly broad-based” across countries and sectors. He continued by saying that it’s driven predominantly by a “virtuous circle” of employment and consumption.
Growth above potential and inflation that is nominally in line with the ECB’s goal have raised speculation among investors that an exit is near. Governing Council Member Vitas Vasiliauskas said in a Bloomberg interview last week that officials should use their June 8 meeting in Tallinn to start building the case for unwinding stimulus before making an announcement in the fall.
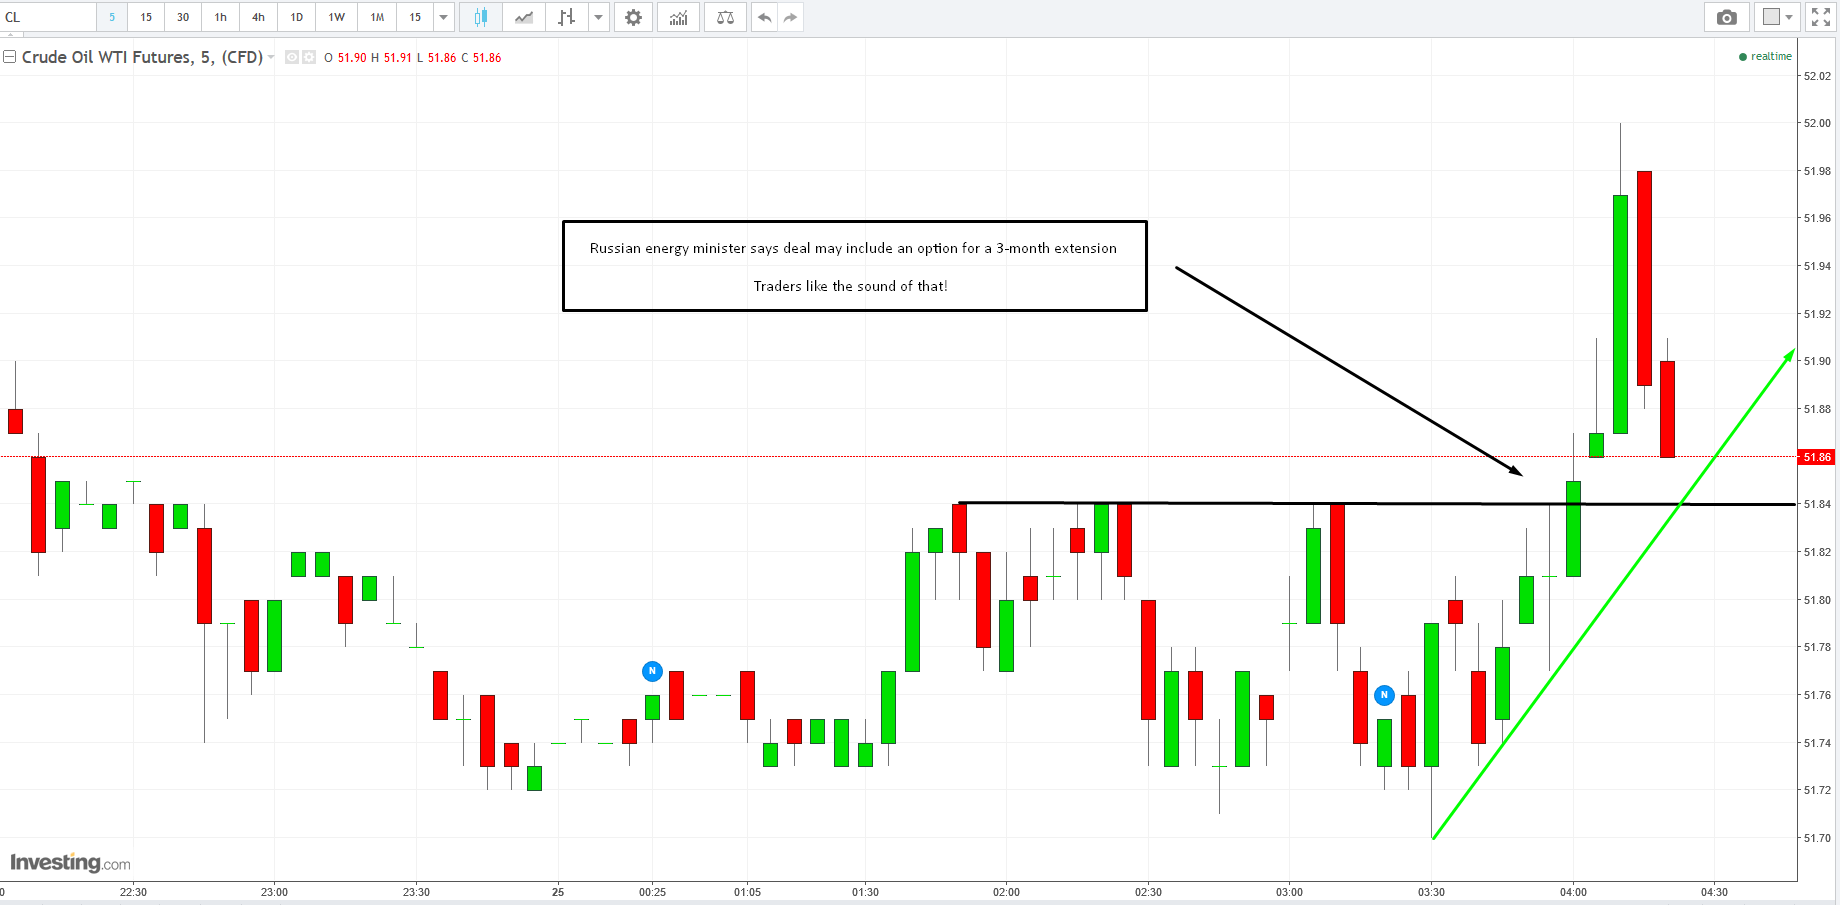
In other news, oil continues its biggest rise since last November, since its May 5th low of $43.76. During that time, non-US oil producers reached a deal to cut production, the topic of today's OPEC meeting, and Russia’s energy minister announced that a nine-month extension to the cuts may include an option for an extra three months.
The South Korean central bank kept rates steady, sending the KOSPI to a record high. The KOSPI's rally was second only to its Chinese counterpart, which climbed 3.6% to its highest level since March, which was led by the financial sector. This comes only a day after Moody’s cut China’s credit rating for the first time in nearly a decade which subsequently led to the Shanghai Composite Index's fall by 1.29%, only to climb back up and close on a small but actual gain of 0.07%.
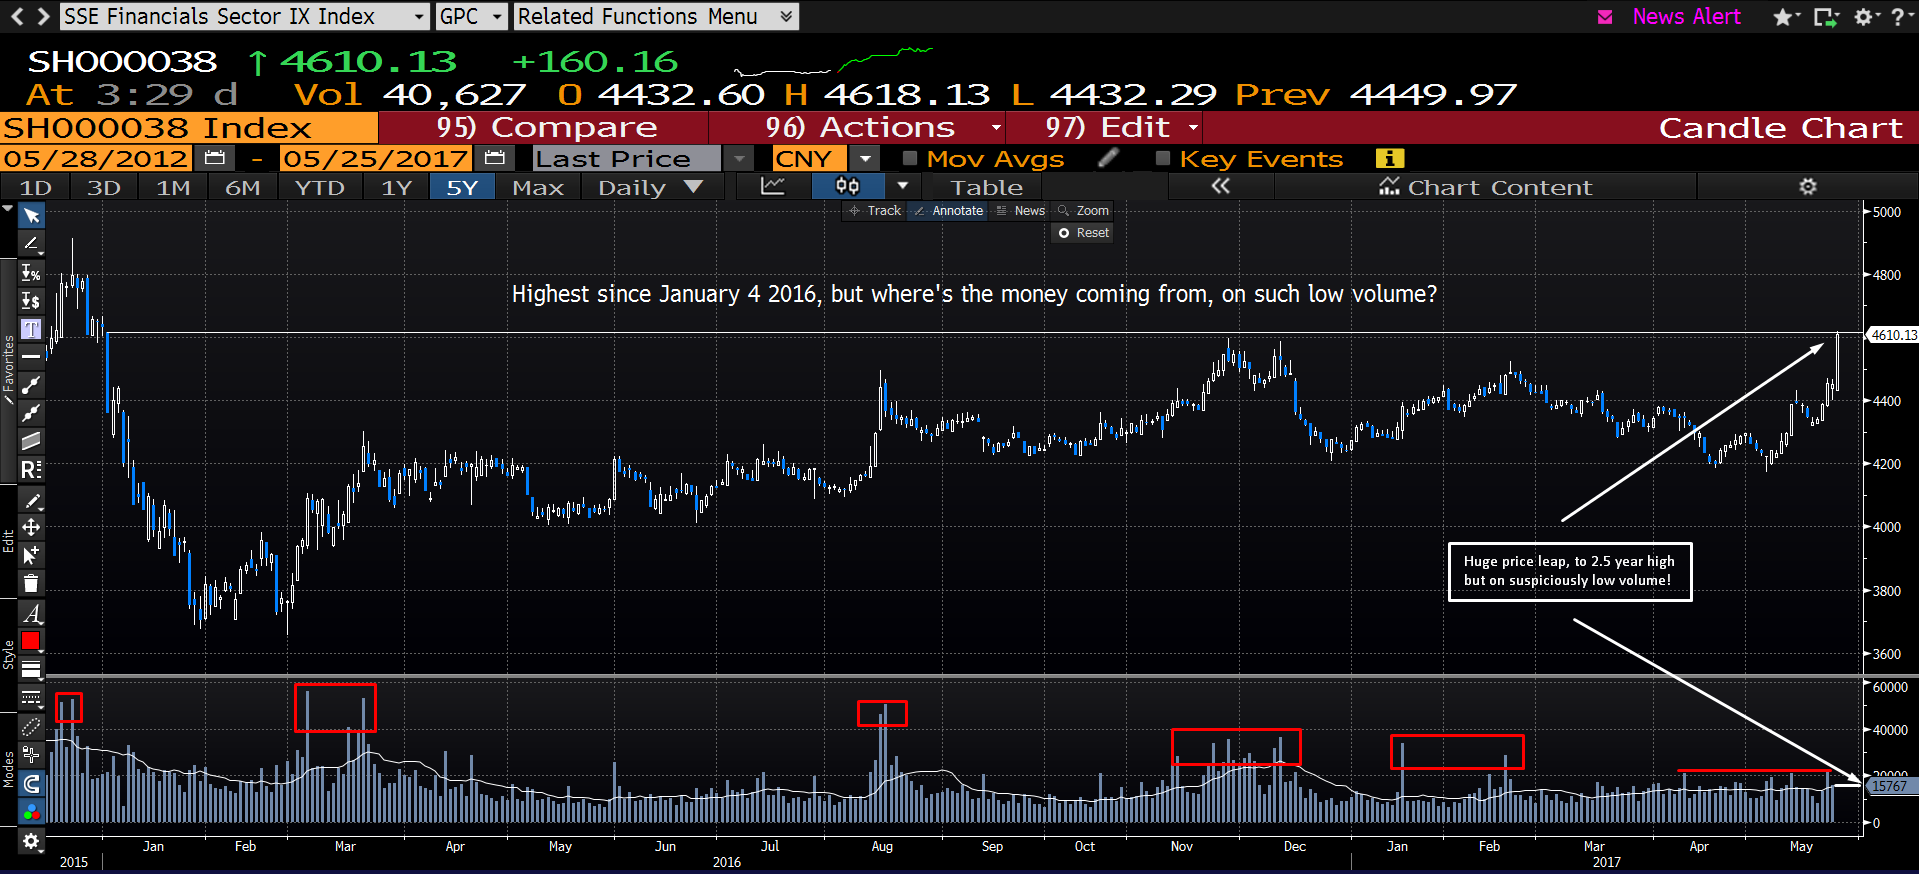
Despite an official reduction in China’s ability to repay debt—due to rising shortfalls alongside a contracting economy, the result of existing capital flight—Chinese shares are roaring away. Another explanation for China's continued growth is that their economy is being fueled by state intervention. Notice in the chart above that while today’s leap in the Shanghai Stock Exchange Financials Sector Index was the most since December 2, 2015, and reached a 2.5 year high, volume is on the lower side. Note how other big rallies or highs reached are followed by proportionate volume...today has both attributes, but on very little volume. Who other than the actual government of China has the will or wherewithal to create so much demand?
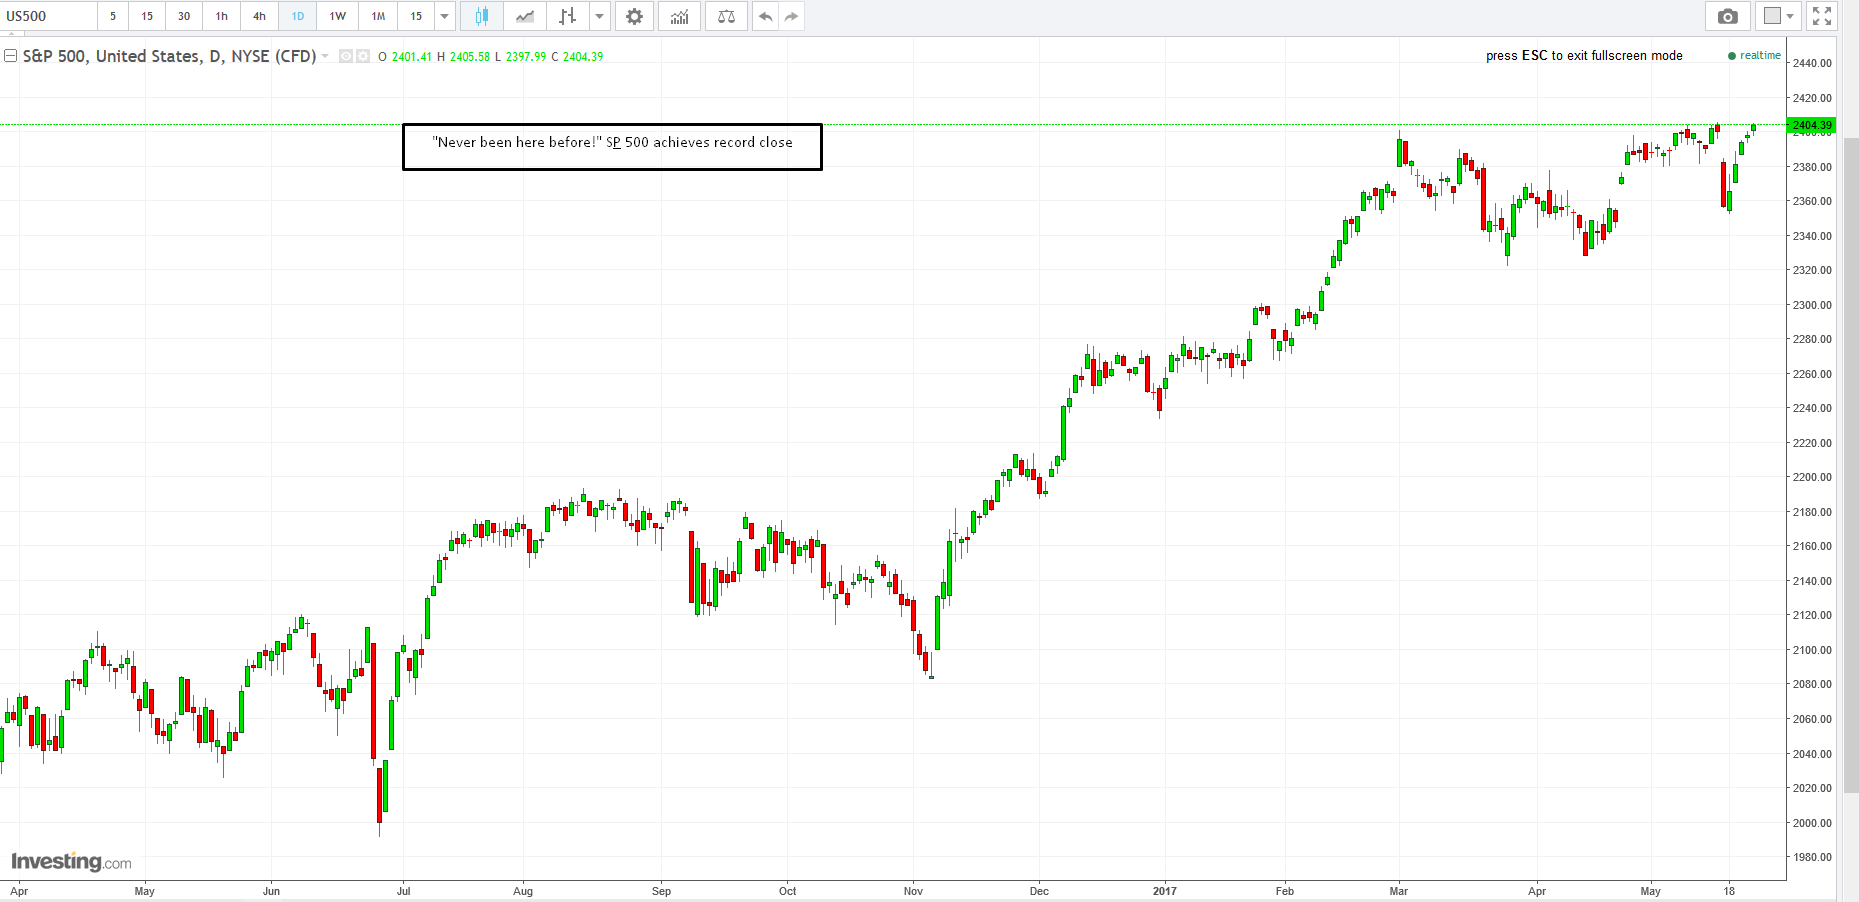
In the US, it appears that traders won't let politics dampen bullishness. Despite the string of reports suggesting collusion between the Trump campaign and Russia, and even after the appointment of a special investigator to look into the situation, the S&P 500 yesterday still achieved a record high close. Is it simply because Trump’s travels pushed the investigation out of the spotlight, or is it because investors only see business growth and are not worried by his investigations?
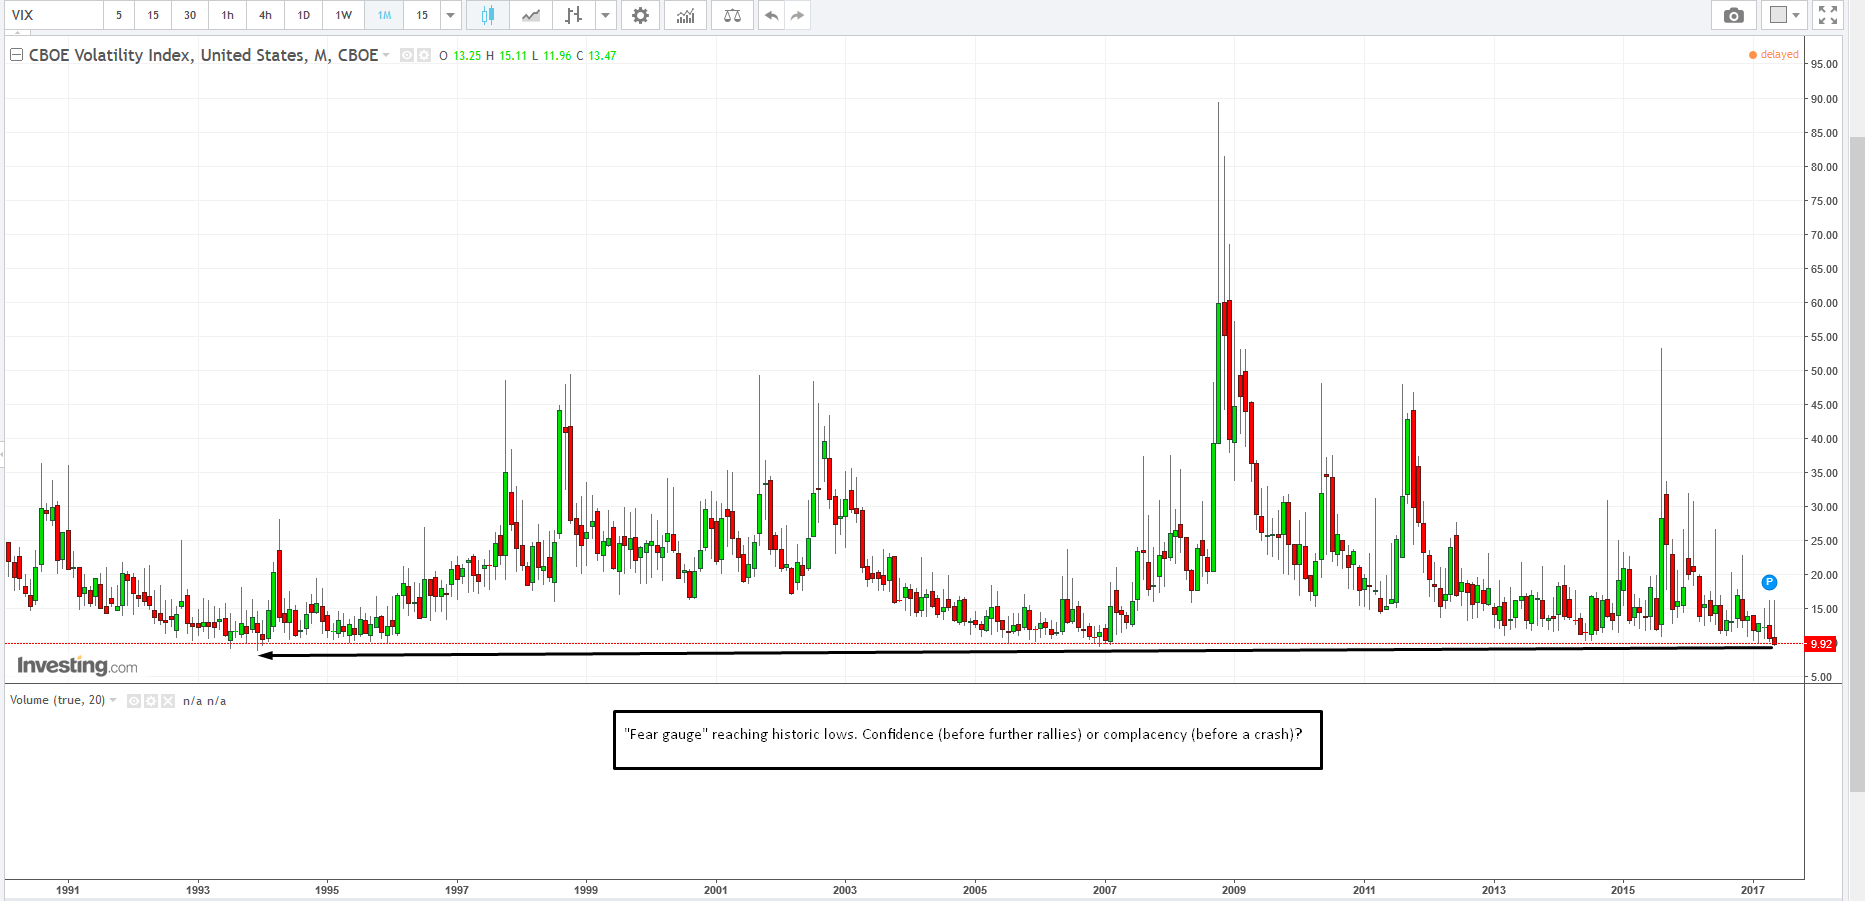
There is the feeling that investors don't want to be caught on the sidelines while the market makes new highs. But isn't that the classic psychology of a market top? Throughout, the VIX is on its fourth straight decline, reaching the historic levels of May 9. Is it confidence or complacency?
Putting aside the surprisingly lower US inflation, we don’t know what Trump’s special investigator might find at any given moment. China has been masking massive capital flight, ongoing for months, by injecting liquidity. Where is the breaking point for markets? On top of it all, North Korea has launched ballistic missiles. All this is occurring when equities are at historically high valuations.
Today's Events
- OPEC is meeting in Vienna. Investors are eager for a contract that extends the deal more than the expected, nine-month period, and for new details on Russia's option for an additional 3-month extension.
- UK GDP is released at 4:30 EDT. Both QoQ and YoY are expected to remain flat, at 0.3% and 2.01%, respectively. Traders, investors and politicians are expected to follow the release closely, after the UK broke off Brexit negotiations with the EU, over membership dues dispute. Will sterling show the same resilience to disappointing economic growth as it did to the recent devastating terror attack?
Market Moves
Commodities
- Crude rose 0.7 percent to $51.74 a barrel as of 8:18 a.m. in London, after touching its highest level in more than a month.
- Gold fell less than 0.1 percent to $1,258.08 an ounce.
Stocks
- The MSCI Asia Pacific Index jumped 0.8 percent to the highest level since May 2015.
- Japan’s TOPIX index rose 0.2 percent.
- Taiwan’s TAIEX extended gains to its highest since 2000.
- The Hang Seng China Enterprise Index soared 1.7 percent, climbing above 10,500 for the first time since March 29. The Shanghai Composite jumped 1.4 percent, the most since April 5, while the Hang Seng Index rose 0.8 percent to its highest in almost two years.
- The STOXX Europe 600 rose 0.1 percent.
- South Korea’s Kospi index climbed 1.1 percent to an all-time high. The Bank of Korea, in its first decision since the nation elected a new president, left its key interest rate unchanged as household debt continues to rise and the economy shows signs of improvement.
- Futures on the S&P 500 rose 0.3 percent. The underlying gauge rose 0.3 percent Wednesday.
Currencies
- The Dollar Index opened on a falling gap of 0.08% and continued to decline to 0.1%, before climbing back up to the price levels of yesterday’s close.
- The yen fell 0.2 percent to 111.76 per dollar after the Japanese currency climbed 0.3 percent Wednesday.
- The South Korean won rallied 0.9 percent.
- China’s offshore yuan climbed 0.2 percent.
- The euro gained 0.1 percent to $1.1233.
- The British pound also rose 0.1 percent.
Bonds
- The yield on 10-year Treasury notes rose less than 0.1 percent to 2.26 percent, after losing three basis points to 2.25 percent on Wednesday.
- Australian benchmark yields dropped four basis points to 2.44 percent.
- French 10- year yields fell two basis points while those in Germany and the UK dropped three basis points.
