The Shorts Dance Continues But Technicals Still Bullish

Published 01/29/2019, 12:15 AM
Updated 07/09/2023, 06:31 AM
NDX
-
US500
-
DJI
-
US2000
-
SOX
-

It seems every market gain is soon followed by a loss (and a potential shorting opportunity), but each time shorts are left hung out to dry. Will yesterday any different? Probably not, but whipsaw trades remain a key risk after a bounce like the one we have seen.

Of the low hanging fruit, we have a Dow Jones Index which has reversed off resistance (and 200-day MA), albeit with a small bullish hammer (the significance of which is reduced as the index is overbought on near term stochastics—but not on an intermediate time frame). The 50-day MA is available to use as support, and relative performance is positive versus the NASDAQ 100. While action suggests this will break through its 200-day MA, the short position has a small edge until proven otherwise.
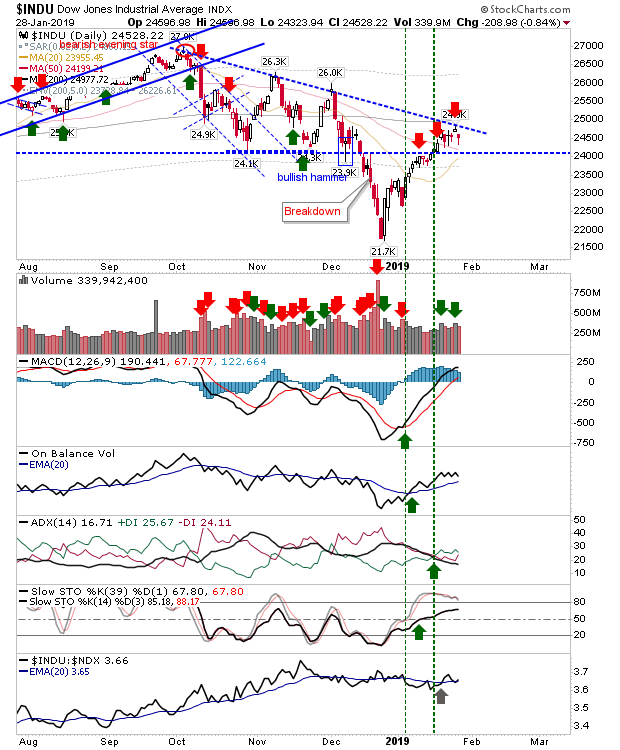
INDU Daily Chart

The S&P is clustered around the 50-day MA with bullish technicals, bar the relative underperformance against the Russell 2000. Selling volume was also lighter, which is another tick in the bull column. Action over the past week looks like a consolidation of the rally; look for another move higher as long positions look favored.
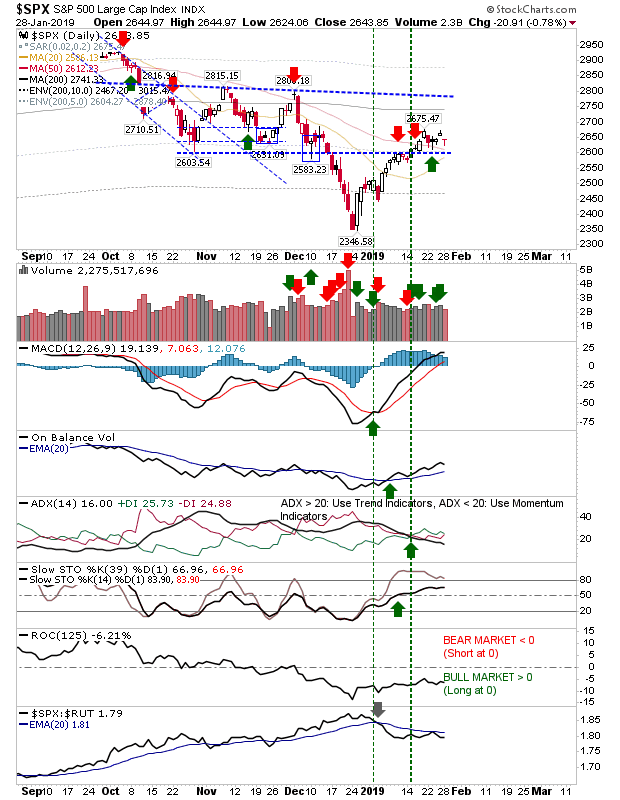
SPX Daily Chart


The NASDAQ also is lingering at declining resistance. I had marked a resistance-level shorting opportunity, which would still be in play, but yesterday's action with technicals the way they are, suggests bulls are going to outlast bears.
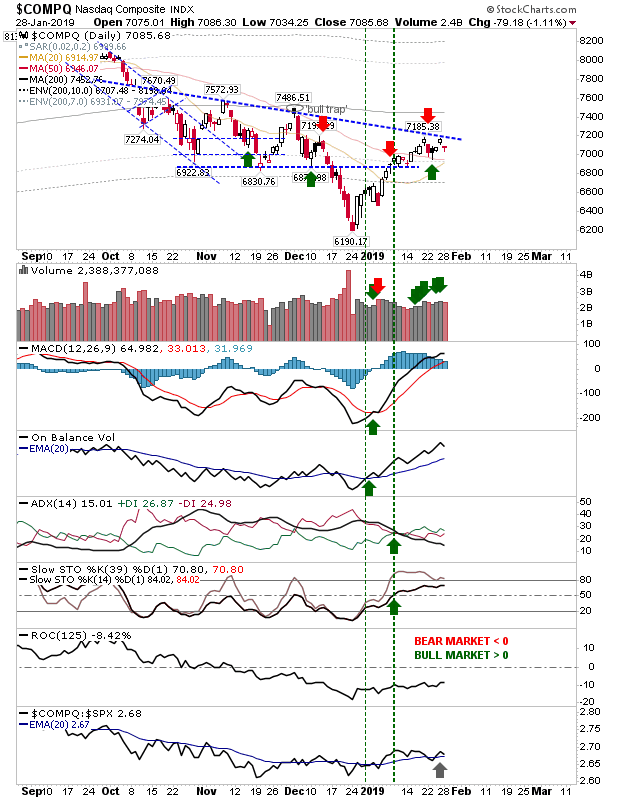
COMPQ Daily Chart


The Russell 2000, having recovered support, is challenging the 'bull trap' with room for upside to declining resistance. With technicals bullish and relative performance in the ascendancy, it looks like longs will get another chance to press their advantage and potentially push through declining resistance.
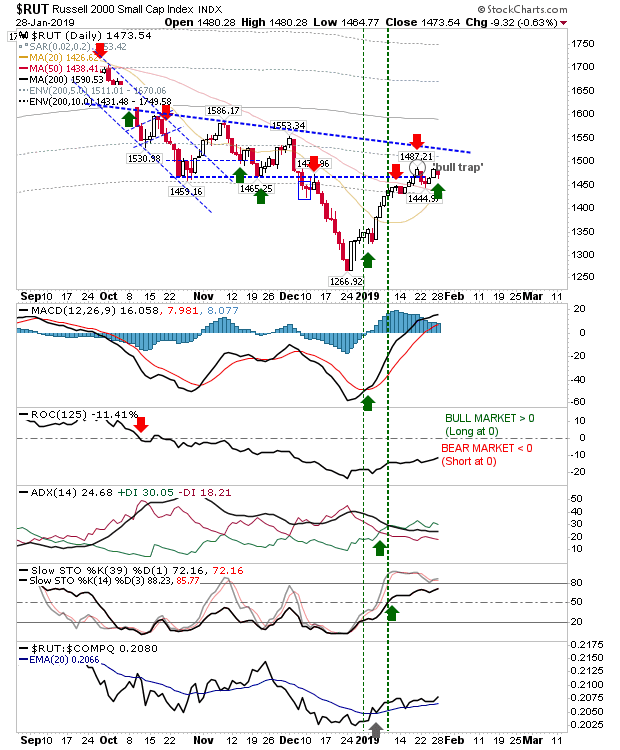
RUT Daily Chart


Semiconductors took the biggest loss on the day but this is coming after a couple of days of stronger gains; the index has the volatility but it has so far sided with bulls. This index looks like it will be the guide for the lead indices.
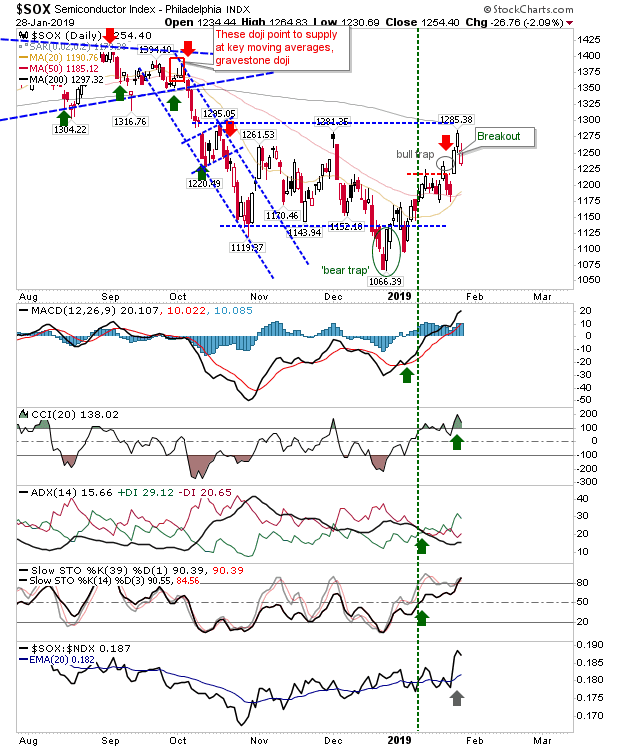
SOX Daily Chart


Those who are short may get another day out of their trades. Longs can look to trade with risk measures on a loss of last week's lows or 50-day MAs. With technicals still bullish, odds remain favorable for long positions.

Latest comments

Loading next article…
Risk Disclosure: Trading in financial instruments and/or cryptocurrencies involves high risks including the risk of losing some, or all, of your investment amount, and may not be suitable for all investors. Prices of cryptocurrencies are extremely volatile and may be affected by external factors such as financial, regulatory or political events. Trading on margin increases the financial risks.
Before deciding to trade in financial instrument or cryptocurrencies you should be fully informed of the risks and costs associated with trading the financial markets, carefully consider your investment objectives, level of experience, and risk appetite, and seek professional advice where needed.
Fusion Media would like to remind you that the data contained in this website is not necessarily real-time nor accurate. The data and prices on the website are not necessarily provided by any market or exchange, but may be provided by market makers, and so prices may not be accurate and may differ from the actual price at any given market, meaning prices are indicative and not appropriate for trading purposes. Fusion Media and any provider of the data contained in this website will not accept liability for any loss or damage as a result of your trading, or your reliance on the information contained within this website.
It is prohibited to use, store, reproduce, display, modify, transmit or distribute the data contained in this website without the explicit prior written permission of Fusion Media and/or the data provider. All intellectual property rights are reserved by the providers and/or the exchange providing the data contained in this website.
Fusion Media may be compensated by the advertisers that appear on the website, based on your interaction with the advertisements or advertisers.
© 2007-2025 - Fusion Media Limited. All Rights Reserved.