⭐ Start off 2025 with a powerful boost to your portfolio: January’s freshest AI-picked stocksUnlock stocks

World Financials Battle Approaches

Published 08/16/2018, 12:15 AM
Updated 07/09/2023, 06:31 AM
US500
-
STOXX50
-
EEM
-
DX
-
GXC
-
XLF
-
SSEC
-
EUFN
-
EMB
-

The first three ratio charts show:

  1. the U.S. Financial ETF (NYSE:XLF) compared with the SPX,
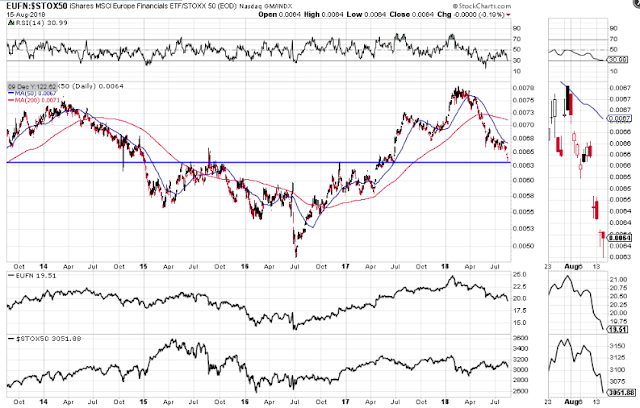
  2. the European Financial ETF (NASDAQ:EUFN) compared with the STOX50, and
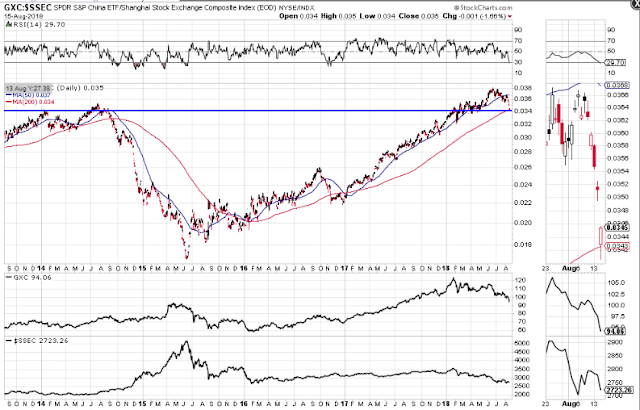
  3. the Chinese Financial ETF (NYSE:GXC) compared with the SSEC.

Each one's Financial ETF is weaker than its country's major index, and in the case of the EUFN and GXC ratios, are sitting at a major support level, while the XLF ratio is approaching major support.
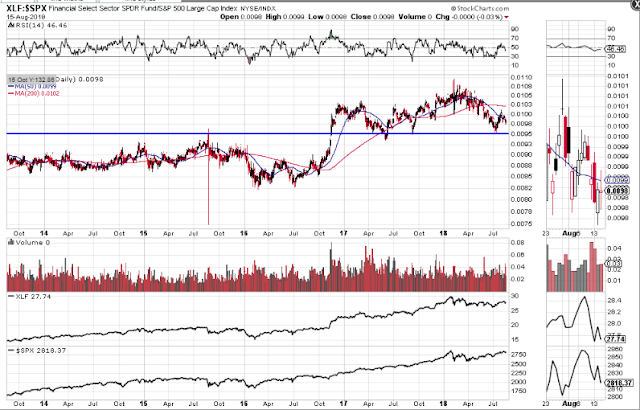
XLF:SPX Daily 2013-2018

EUFN:STOX50 Daily 2013-2018

GXC:SSEC Daily 2013-2018


The fourth ratio chart shows that the Emerging Markets Bond ETF (NASDAQ:EMB) is stronger than its counterpart Emerging Markets ETF (NYSE:EEM) and is approaching a major resistance level. (Note that EMB holds USD-denominated rather than local-currency debt, and eliminates direct currency risk for U.S. investors, but raises the possibility that a strengthening dollar or weakening local currency could make the debt harder to service, increasing credit risk.)
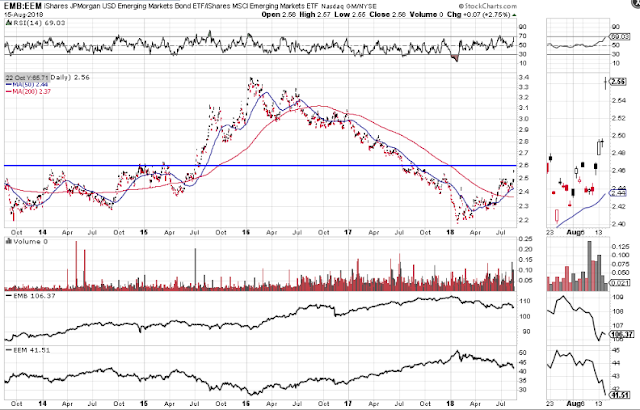
EMB:EEM Daily 2013-2018


The next chart of the USD shows price approaching its next major resistance level at 97.50.
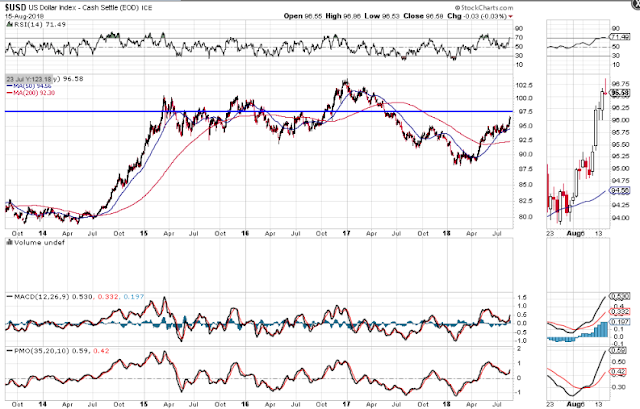
DX Daily 2013-2018

The next ratio chart shows the strengthening of the USD compared to EMB since the end of January. Price has a way to go before it hits its next major resistance level.
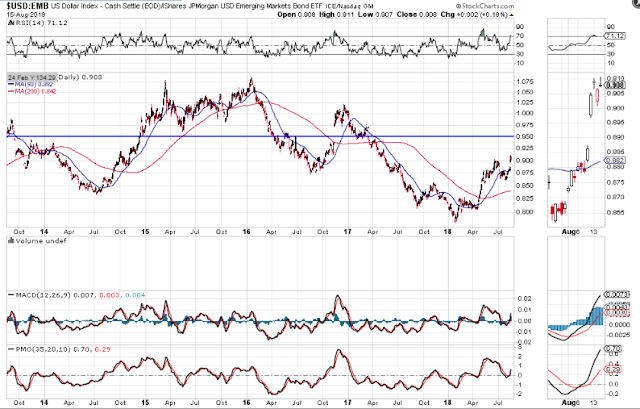
USD:EMB Daily 2013-2018


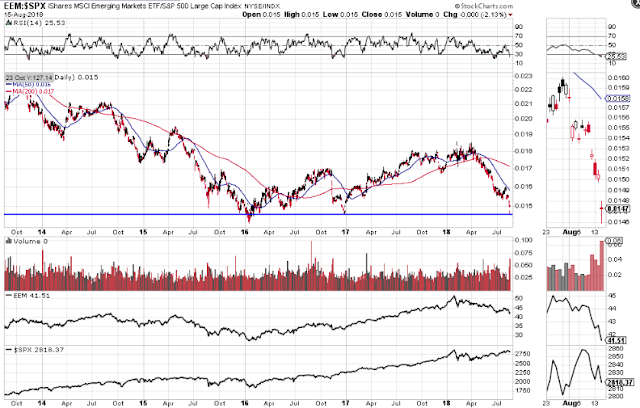
The last three ratio charts compare price of the STOX50, SSEC, and EEM to the SPX. They are all much weaker than the SPX; the STOX50 and EEM ratios are sitting on major support, and the SSEC ratio is trading below major support.
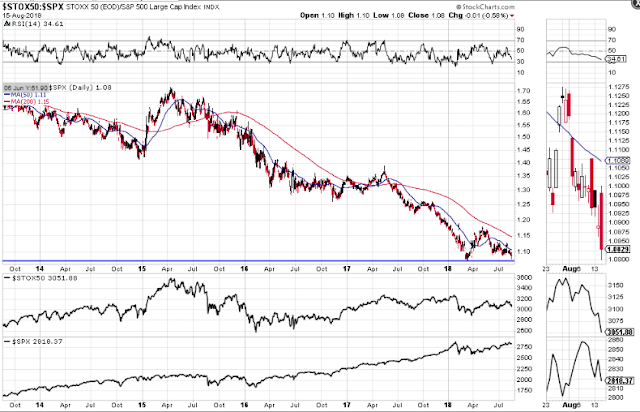
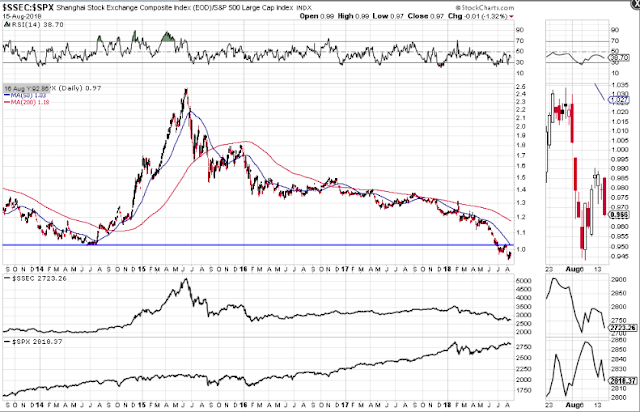
STOX50:SPX Daily 2013-2018

SSEC:SPX Daily 2013-2018

EEM:SPX Daily 2013-2018


The last graph shows the percentages lost in the SPX, XLF, STOX50, EUFN, SSEC, GXC, EEM and EMB since they peaked around the end of January this year, as well as the gains made, conversely, in the USD.
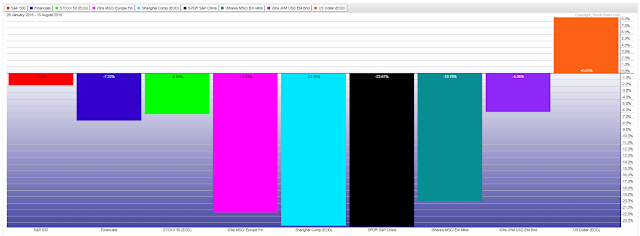
SPX:XLF:STOX50:EUFN:SSEC:GXC:EEM:EMB vs USD 1/26-8/15 2018


Unless all of the three Financial ETFs firm up and attract new buyers soon, we'll see weakness continue, and possibly accelerate, in European, Chinese and Emerging Markets, potentially dragging U.S. equities down, as well. Keep a close eye on the USD as a potential flight-to-safety trade in such an event.

With respect to the U.S. market, I'd also refer you to my comments outlined during the past month in my posts here, here, here and here, which describe other factors I'm watching.

Latest comments

Loading next article…
Risk Disclosure: Trading in financial instruments and/or cryptocurrencies involves high risks including the risk of losing some, or all, of your investment amount, and may not be suitable for all investors. Prices of cryptocurrencies are extremely volatile and may be affected by external factors such as financial, regulatory or political events. Trading on margin increases the financial risks.
Before deciding to trade in financial instrument or cryptocurrencies you should be fully informed of the risks and costs associated with trading the financial markets, carefully consider your investment objectives, level of experience, and risk appetite, and seek professional advice where needed.
Fusion Media would like to remind you that the data contained in this website is not necessarily real-time nor accurate. The data and prices on the website are not necessarily provided by any market or exchange, but may be provided by market makers, and so prices may not be accurate and may differ from the actual price at any given market, meaning prices are indicative and not appropriate for trading purposes. Fusion Media and any provider of the data contained in this website will not accept liability for any loss or damage as a result of your trading, or your reliance on the information contained within this website.
It is prohibited to use, store, reproduce, display, modify, transmit or distribute the data contained in this website without the explicit prior written permission of Fusion Media and/or the data provider. All intellectual property rights are reserved by the providers and/or the exchange providing the data contained in this website.
Fusion Media may be compensated by the advertisers that appear on the website, based on your interaction with the advertisements or advertisers.
© 2007-2025 - Fusion Media Limited. All Rights Reserved.