It is unsettling to deal with the probability that we are closer to a bearish decline in stocks than a bullish reboot. Investment account values will wane. Household net worth will diminish. And when stock prices near their lowest ebb, the typical investor will decide that buying is impractical.
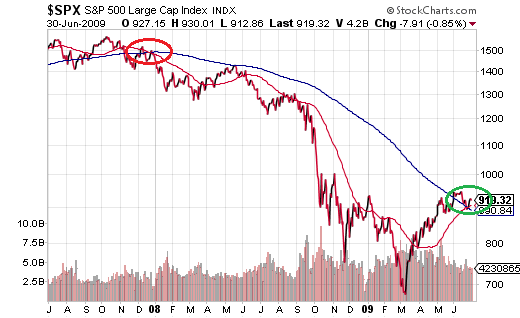
However, if one prepares for inevitable depreciation in overvalued asset prices, buying low becomes less intimidating. For example, in spite of the exceptionally poor rap that trend-following techniques receive from the mainstream financial media, a decision to “stand down” when the 50-day crossed below the 200-day in the previous stock bear provided a remarkably desirable return OF capital. A subsequent decision to embrace risk when the 50-day crossed above the 200-day provided a remarkably desirable entry point for a return ON capital. Selling the S&P 500 near 1500 (a.k.a. “selling high”) and purchasing it again near 900 (a.k.a. “buying low”) helped one successfully transition from capital preservation to capital appreciation.
At the current moment, far too many folks are being led astray by talking points they hear on CNBC and Bloomberg. For instance, popular shows regularly trot out analysts who insist that that market is “grinding higher.” First of all, which market is grinding higher? The Dow Jones Industrials, Dow Jones Transportation, S&P 500, S&P Midcap 400, Russell 2000 and New York Stock Exchange Composite are all lower than they were one year ago. (Note: Ironically enough, the Fed’s last asset purchase actually occurred on 12/18/2014, making 12/17/2015 the end of a full trading year.)
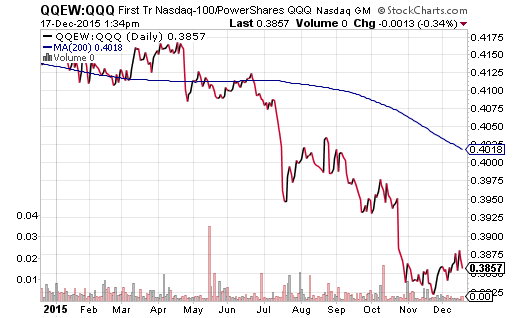
It follows that the only significant U.S. index that has made genuine progress since the end of the Federal Reserve’s quantitative easing (QE3) is the Nasdaq 100. Even there, progress is less impressive when one weights the components of the NASDAQ equally, rather than rely on the super-sized weightings of Facebook (FB), Amazon (AMZN), Netflix (NFLX) and Google (GOOGL). This is evident in the deterioration of the First Trust Equal Weight NASDAQ 100 (QQEW):PowerShares Nasdaq 100 ETF (QQQ) price ratio.
Why is the lack of meaningful progress in so many U.S. stock barometers – the Dow Industrials, Dow Transports, S&P 500, S&P 400, Russell 2000, New York Stock Exchange (NYSE) Composite – being overlooked? The most common answer that I am hearing is the prospect of a “breather.” A proverbial “pause” for U.S. stocks in the middle of a bullish cycle.
The problems with the “breather” belief are numerous. For one thing, where consolidation has occurred during previous “pauses,” the number of advancing stocks on the exchanges relative to the the number of declining issues usually move higher. Consider the euro-zone crisis in the summertime of 2011 – the last time stocks experienced anything close to a sharp correction. The NYSE Advance/Decline Line (A/D) offered ample signs of a healthier stock market with a series of “higher lows” and “higher highs.” In essence, the number of advancers began to eviscerate the number of decliners.
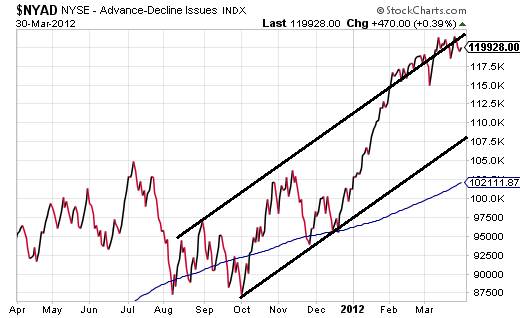
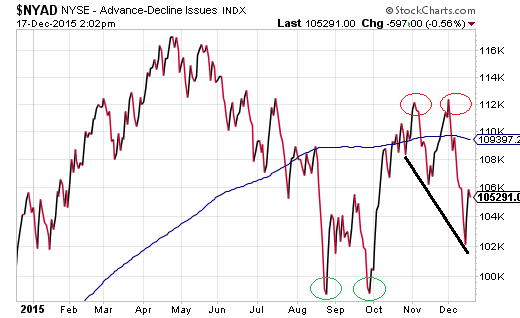
If one is inclined to believe that the current stock bull is merely catching its breath for a second wind, shouldn’t we see the same kind of improving breadth here in 2015? Like we did in 2011? Yet, over the past year, more stocks in the US have been declining than advancing for the first time since 2009. Moreover, the NYSE A/D Line is not currently demonstrating the kind of resilience that previous bullish rallies demonstrated.
A second shot across the “breather” bow is the earnings environment. Combine the strong dollar, low commodity prices, higher borrowing costs, and we’re about to see our third consecutive quarterly decline in S&P 500 earnings. That has not occurred since the systemic financial collapse. What’s more, the profitability concerns are wreaking havoc on traditional valuations; that is, you cannot see a 14% decline in year-over-year earnings, as well as a third consecutive quarter of earnings deterioration, and anticipate anything other than expensive stocks becoming even pricier.
A third dilemma for the “breather” believers? The rest of the world’s stock markets are trading near the levels they were trading when the S&P 500 hit 1867 back in August. Or worse. Many of the world markets are trading at even lower prices than the August lows for the S&P 500. How about the world’s 4th largest economy in the United Kingdom? The iShares United Kingdom ETF (EWU) is far beneath its 200-day moving average and hardly shows any indication that it is ready to rally back to new 52-week highs.
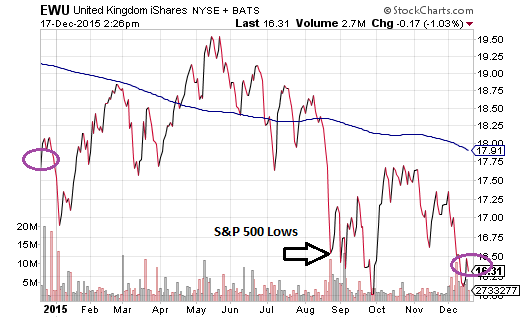
Of course, history only rhymes, it does not repeat. There’s no way to know what will transpire with any certainty. Yet history and probability do not favor the idea that stock markets will magically grind higher. (They haven’t for the last year.) History and probability do not favor a bullish breakout to new records when manufacturing is contracting, earnings and sales are declining, and global economic hardships are increasing.
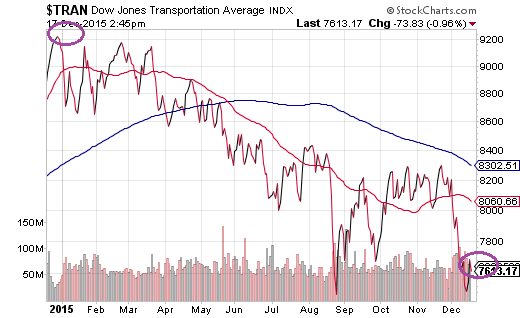
Here is one final item to digest. Several years ago, the U.S. Department of Transportation’s Bureau of Transportation Statistics produced a study that showed how its transportation index “…led slowdowns in the economy by an average of four to five months.” Is there anything in the activity of a similar index – the longest running stock index in U.S. history, the Dow Jones Transportation Index – that suggests U.S. stocks are gearing up for a breakout above all-time highs? Does a 17.25% price drop show that stocks are grinding higher or lower?
Keep a little cash on hand. Not only will it help you sleep better at night, but it will give you the confidence to buy good stuff lower down the road.
