5 Stocks To Watch As China’s Currency Takes Its Next Leg Lower

Published 08/06/2019, 03:35 AM
Updated 11/16/2024, 07:53 AM
UK100
-
US500
-
DE40
-
JP225
-
HK50
-
SPY
-
USD/CNY
-
AMZN
-
AMD
-
DX
-
ESH25
-
CL
-
US10YT=X
-
KS11
-
SSEC
-
VIX
-
JD
-
BABA
-
SQ
-

US Markets

  • S&P 500 Futures -39 points
  • US 10-Year 1.76%
  • Dollar Index 97.71
  • VIX 20.95
  • Oil$55.19
  • International Markets

  • Nikkei -1.74%
  • Shanghai -1.62%
  • Hong Kong -2.85%
  • KOSPI -2.56%
  • DAX -1.55%
  • FTSE -1.98%
  • China’s Currency Falls

    Surprise, surprise. China’s yuan is falling yet again. However, this time, it has dropped to around 7.05 to the dollar. That is the lowest level for the yuan versus the dollar in a decade! Should we be surprised by this? Absolutely not, this has been what China has been doing since the trade war started. Remember it was April 2018 when the currency was at 6.25 to the dollar.

    What’s the best way to fight a trade war with tariffs? Devalue one’s currency. One should expect to see the currency continue to devalue.

    Hard to say how much more it could fall, after all, one must remember that China does not have a free-floating currency.
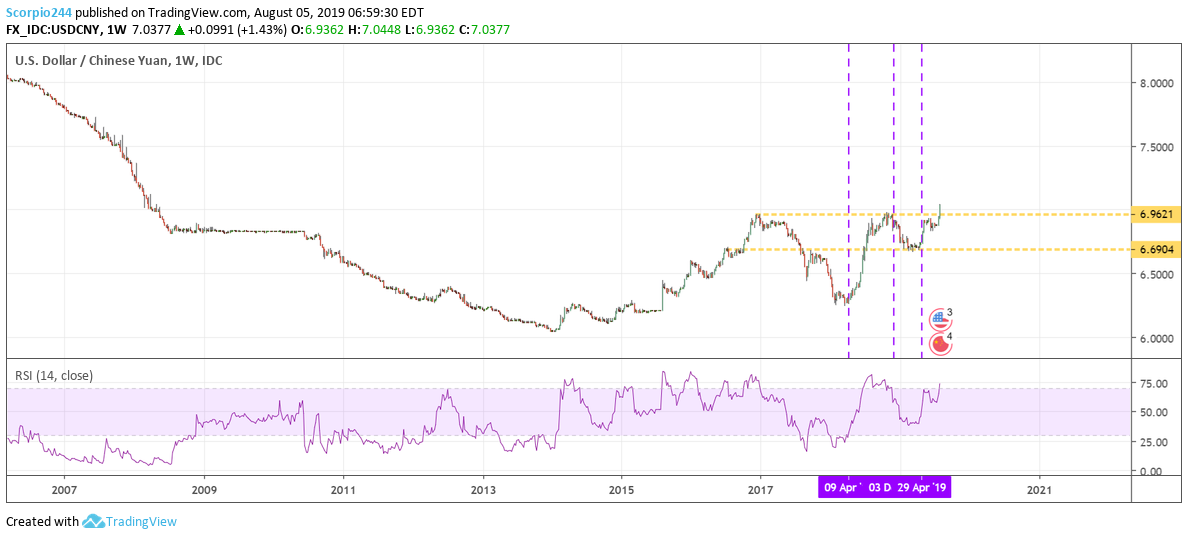
    USDCNY Weekly Chart

    South Korea (EWY)

    Also interestingly the South Korea KOPSI has now fallen below its December lows! I would consider that a pretty major development and one that we will need to continue to watch.
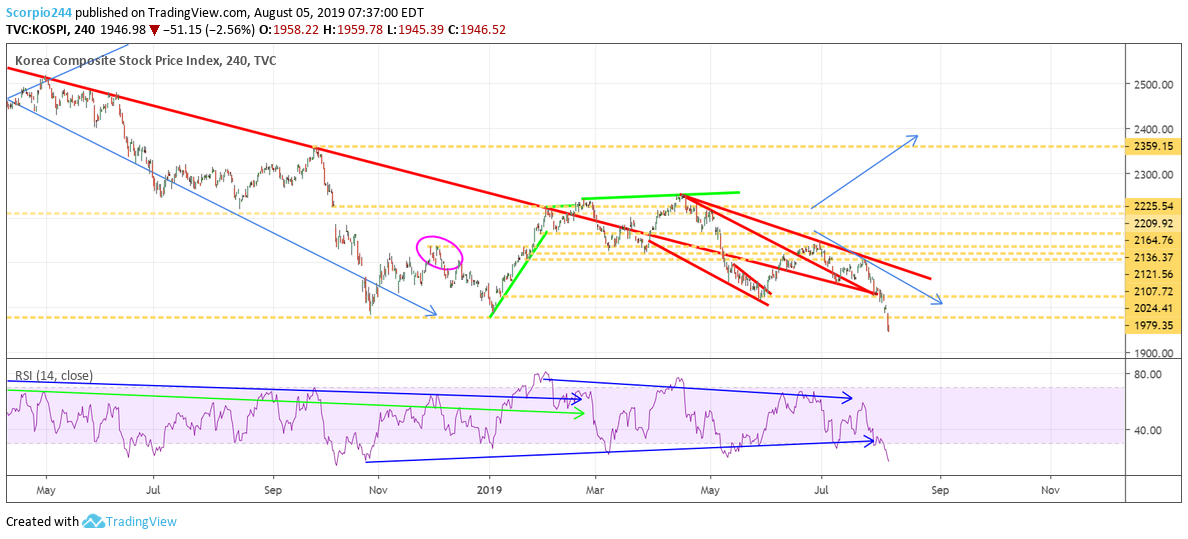
    KOSPI Stock Price Index

    10-Year Yields

    As a result, the 10-year treasury is falling to around 1.75%, that’s the lowest level we have seen in this current cycle.
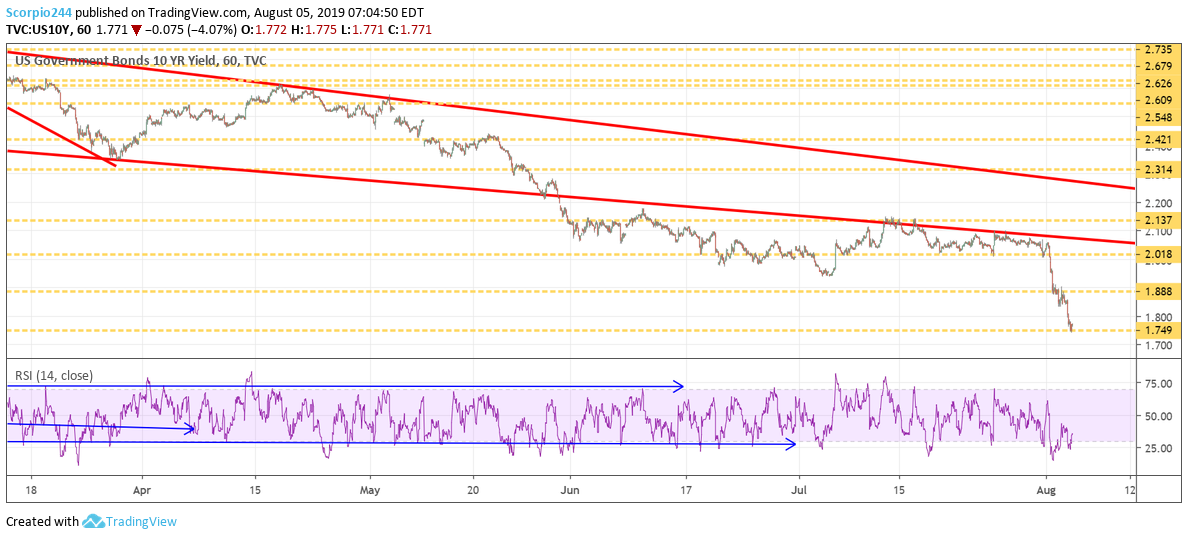
    US 10 Yr Yields Chart

    S&P 500 ETF (SPY)

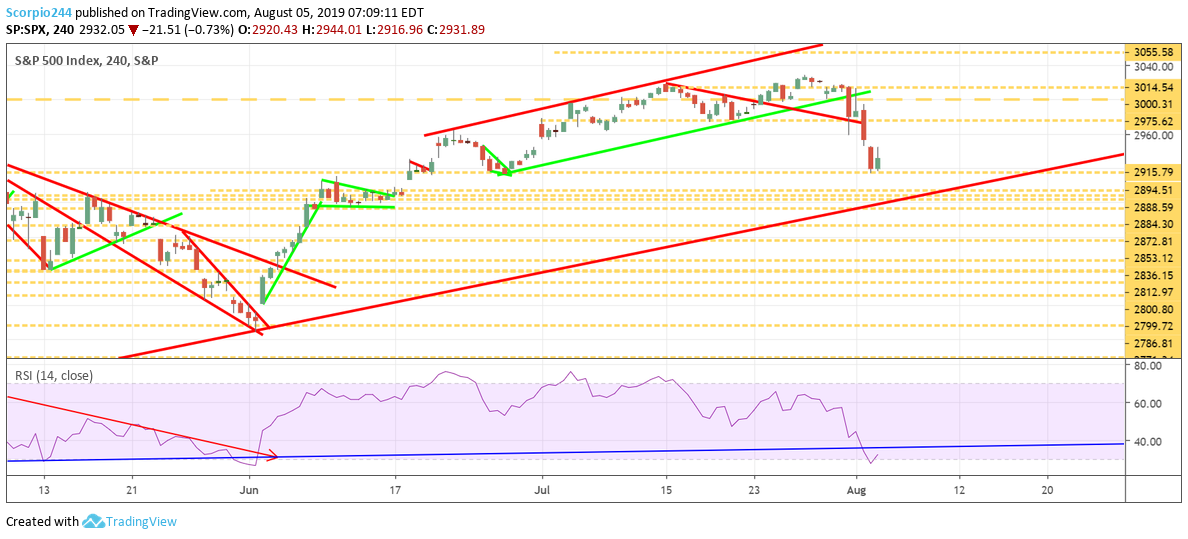
    As of this moment, the SPDR S&P 500 (NYSE:SPY) ETF is trading around $289, which puts that on pare with our level of support we have watched around 2,890.
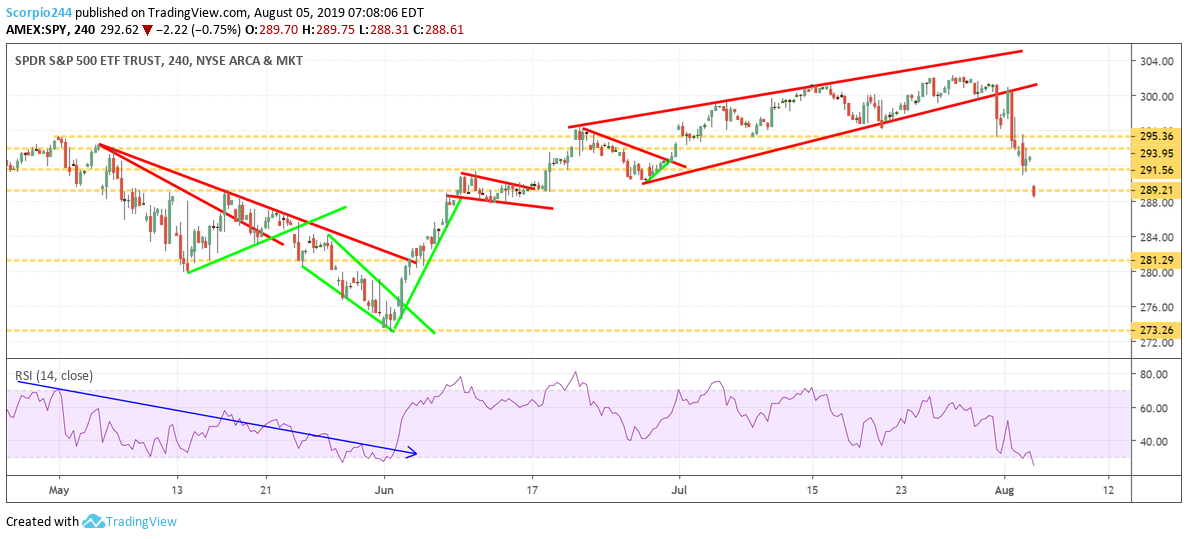
    SPY ETF Trust Chart

    S&P 500

    It means that the next level of support for the S&P 500 falls to around 2,870, should 2,890 not hold.
    SP 500 Index

    JD (JD)

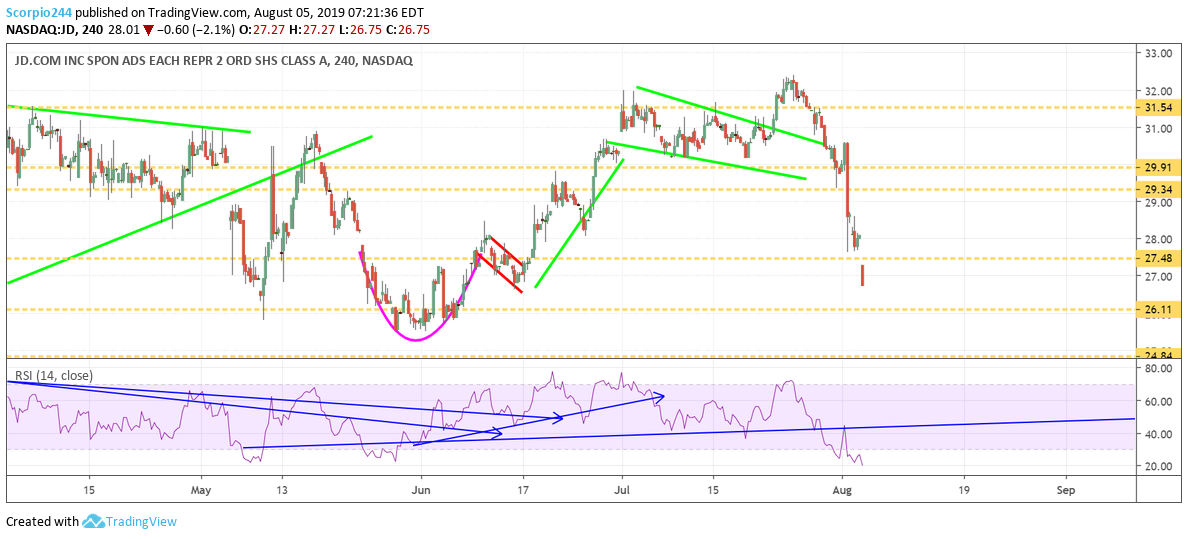
    None of this is good for Chinese ADR’s such as Jd.Com (NASDAQ:JD). Remember, as a weaker yuan hurts the revenue and earnings outlook for this company. It also means that support for the stock falls to around $26.10
    JD Chart

    Alibaba (BABA)

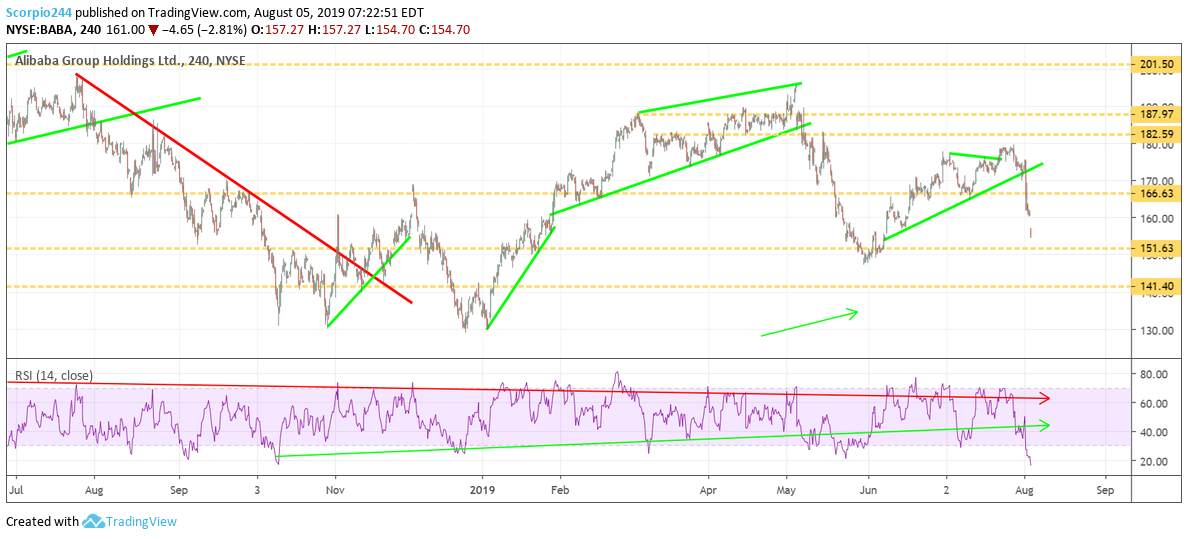
    It is also awful for Alibaba , with the potential for that stock to fall to $151. The next level for Alibaba (NYSE:BABA) after that price doesn’t come until $141.
    Alibaba Chart

    AMD (AMD)

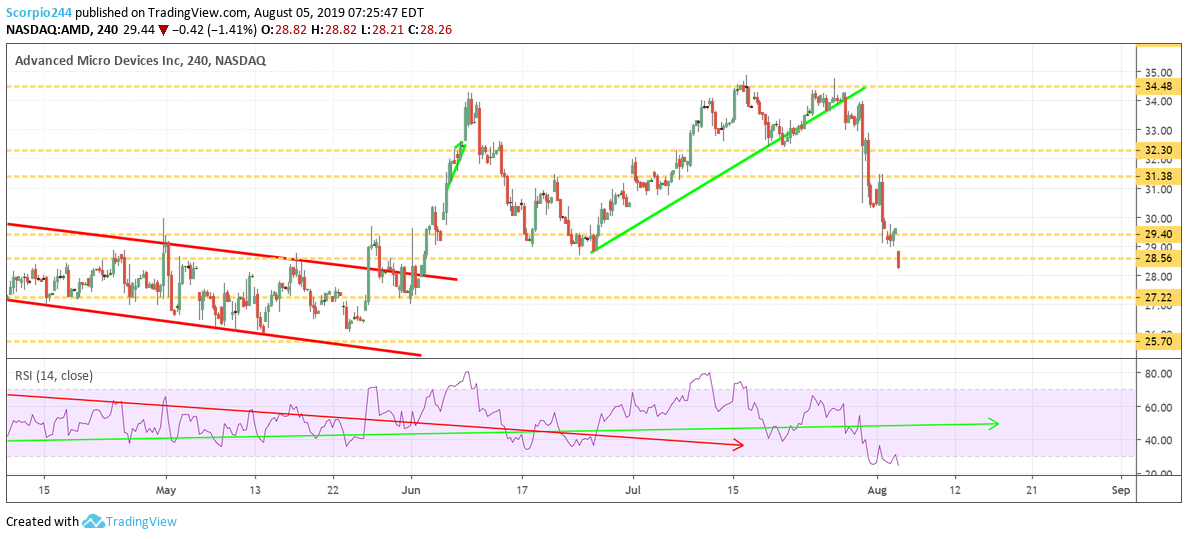
    AMD is also falling today and appears it may not be on its way to $27.22.
    AMD Chart

    Amazon (NASDAQ:AMZN)

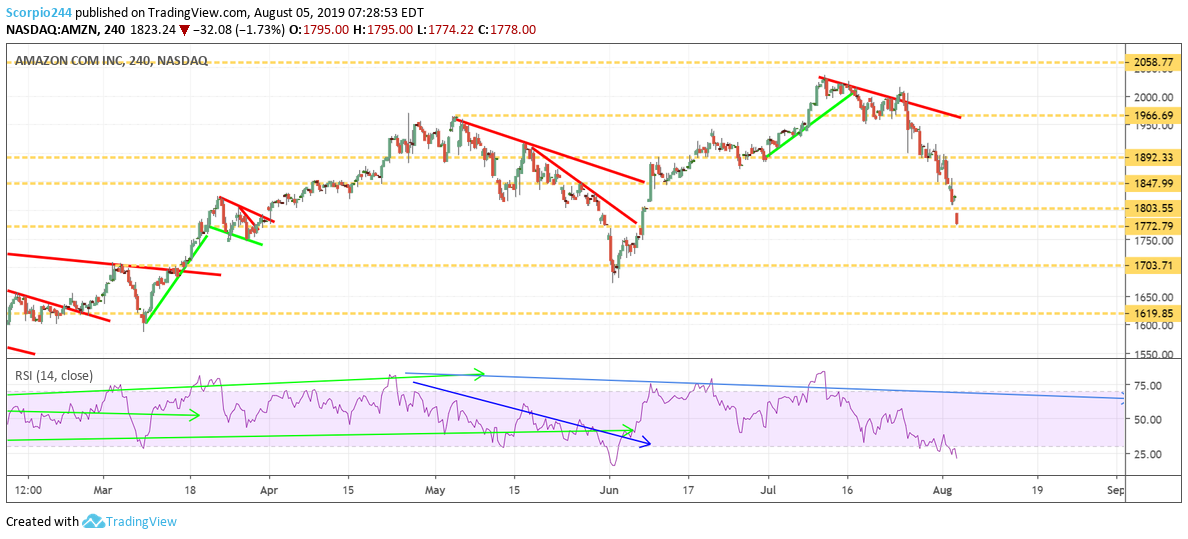
    Amazon (NASDAQ:AMZN) is also falling today, as investors merely take risk-off the table. Support at $1770 is being tested; the next major of support doesn’t come until $1700.
    Amazon Chart

    Square (SQ)

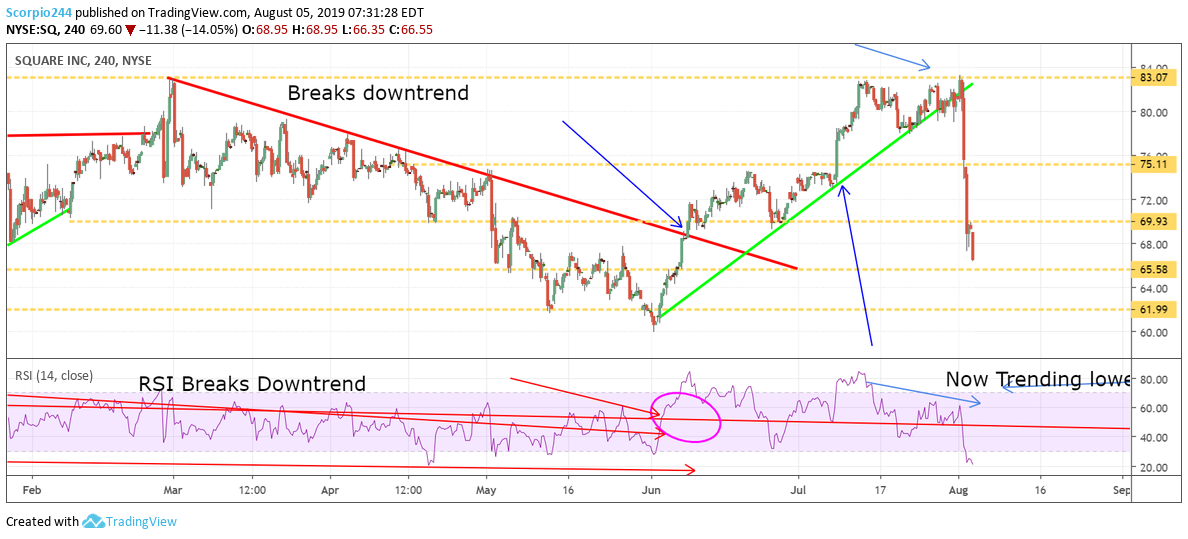
    Square (NYSE:SQ) is also continuing to drop, and the next significant level of support after $65.50 isn’t until $62.
    Square Inc Chart

    Original Post

    Latest comments

    Loading next article…
    Risk Disclosure: Trading in financial instruments and/or cryptocurrencies involves high risks including the risk of losing some, or all, of your investment amount, and may not be suitable for all investors. Prices of cryptocurrencies are extremely volatile and may be affected by external factors such as financial, regulatory or political events. Trading on margin increases the financial risks.
    Before deciding to trade in financial instrument or cryptocurrencies you should be fully informed of the risks and costs associated with trading the financial markets, carefully consider your investment objectives, level of experience, and risk appetite, and seek professional advice where needed.
    Fusion Media would like to remind you that the data contained in this website is not necessarily real-time nor accurate. The data and prices on the website are not necessarily provided by any market or exchange, but may be provided by market makers, and so prices may not be accurate and may differ from the actual price at any given market, meaning prices are indicative and not appropriate for trading purposes. Fusion Media and any provider of the data contained in this website will not accept liability for any loss or damage as a result of your trading, or your reliance on the information contained within this website.
    It is prohibited to use, store, reproduce, display, modify, transmit or distribute the data contained in this website without the explicit prior written permission of Fusion Media and/or the data provider. All intellectual property rights are reserved by the providers and/or the exchange providing the data contained in this website.
    Fusion Media may be compensated by the advertisers that appear on the website, based on your interaction with the advertisements or advertisers.
    © 2007-2025 - Fusion Media Limited. All Rights Reserved.