By April Joyner
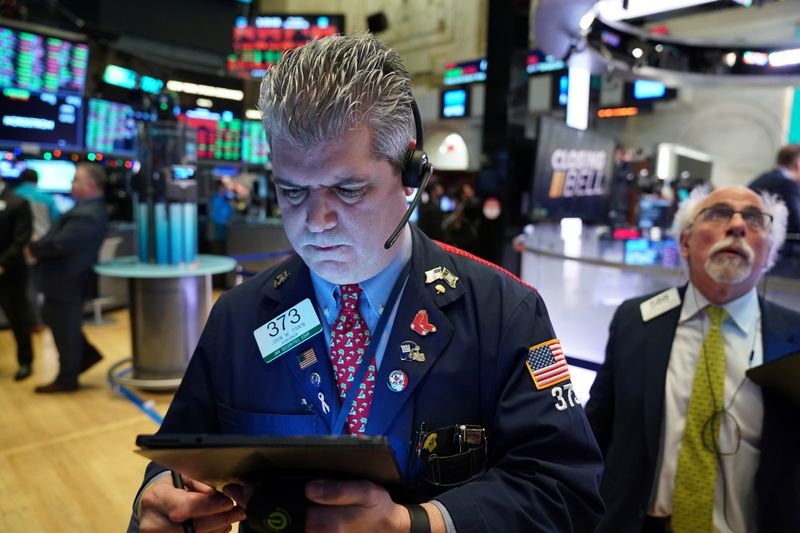
NEW YORK (Reuters) - Wall Street's major stock indexes slipped from record highs on Monday as investors booked profits from gains made this month after the United States and China reached a trade deal.
The S&P 500, the Dow Jones Industrial Average and the Nasdaq posted their biggest one-day percentage declines in about four weeks.
Monday brought minor updates on the U.S.-China trade agreement. White House trade adviser Peter Navarro said the pact was likely to be signed in the next week but that confirmation would come from President Donald Trump or U.S. Trade Representative Robert Lighthizer.
A South China Morning Post report said Chinese Vice Premier Liu He would travel to Washington later this week to sign the deal.
The news provided little impetus for U.S. stocks to extend their steep climb, analysts said. Going into Monday, the benchmark S&P 500 had notched record high closes in nine of the past 11 sessions.
"Many traders and portfolio managers have reached their targets and don't want to jeopardize their performance," said Quincy Krosby, chief market strategist at Prudential Financial (NYSE:PRU) in Newark, New Jersey. "So it's not unusual to see some profit-taking as we get to the close of the year."
The Dow Jones Industrial Average (DJI) fell 183.12 points, or 0.64%, to 28,462.14, the S&P 500 (SPX) lost 18.73 points, or 0.58%, to 3,221.29 and the Nasdaq Composite (IXIC) dropped 60.62 points, or 0.67%, to 8,945.99.
Communications services stocks (SPLRCL) fell 1%, the biggest percentage decline among the S&P 500's sectors. Technology stocks (SPLRCT) dropped 0.6% and weighed most heavily on the benchmark index. Technology, up 47.5% year-to-date, and communication services, up 30.6%, have led in percentage gains on the S&P 500 this year.
It is "not uncommon for the leading sectors to pull back first when people start to sell because if it is an outperformer, then it warrants a lot more downside risk," said Randy Frederick, vice president of trading and derivatives for Charles Schwab (NYSE:SCHW) in Austin, Texas.
On Tuesday, stocks will trade on Wall Street for a full session prior to Wednesday's New Year's Day break. In a bright spot among U.S. stocks, Nio Inc (N:NIO) shares surged 53.7% after the Chinese electric vehicle maker and Tesla (NASDAQ:TSLA) rival beat quarterly revenue estimates on higher demand.
Declining issues outnumbered advancing ones on the NYSE by a 1.43-to-1 ratio; on Nasdaq, a 1.52-to-1 ratio favored decliners.
The S&P 500 posted 17 new 52-week highs and no new lows; the Nasdaq Composite recorded 80 new highs and 29 new lows.

Volume on U.S. exchanges was 6.12 billion shares, below the 6.89 billion average for the full session over the last 20 trading days.